Memorial Park - North York
Civic Square, above average overall (score 41, rank ~80th percentile). Strongest: enclosure; weakest: natural comfort.
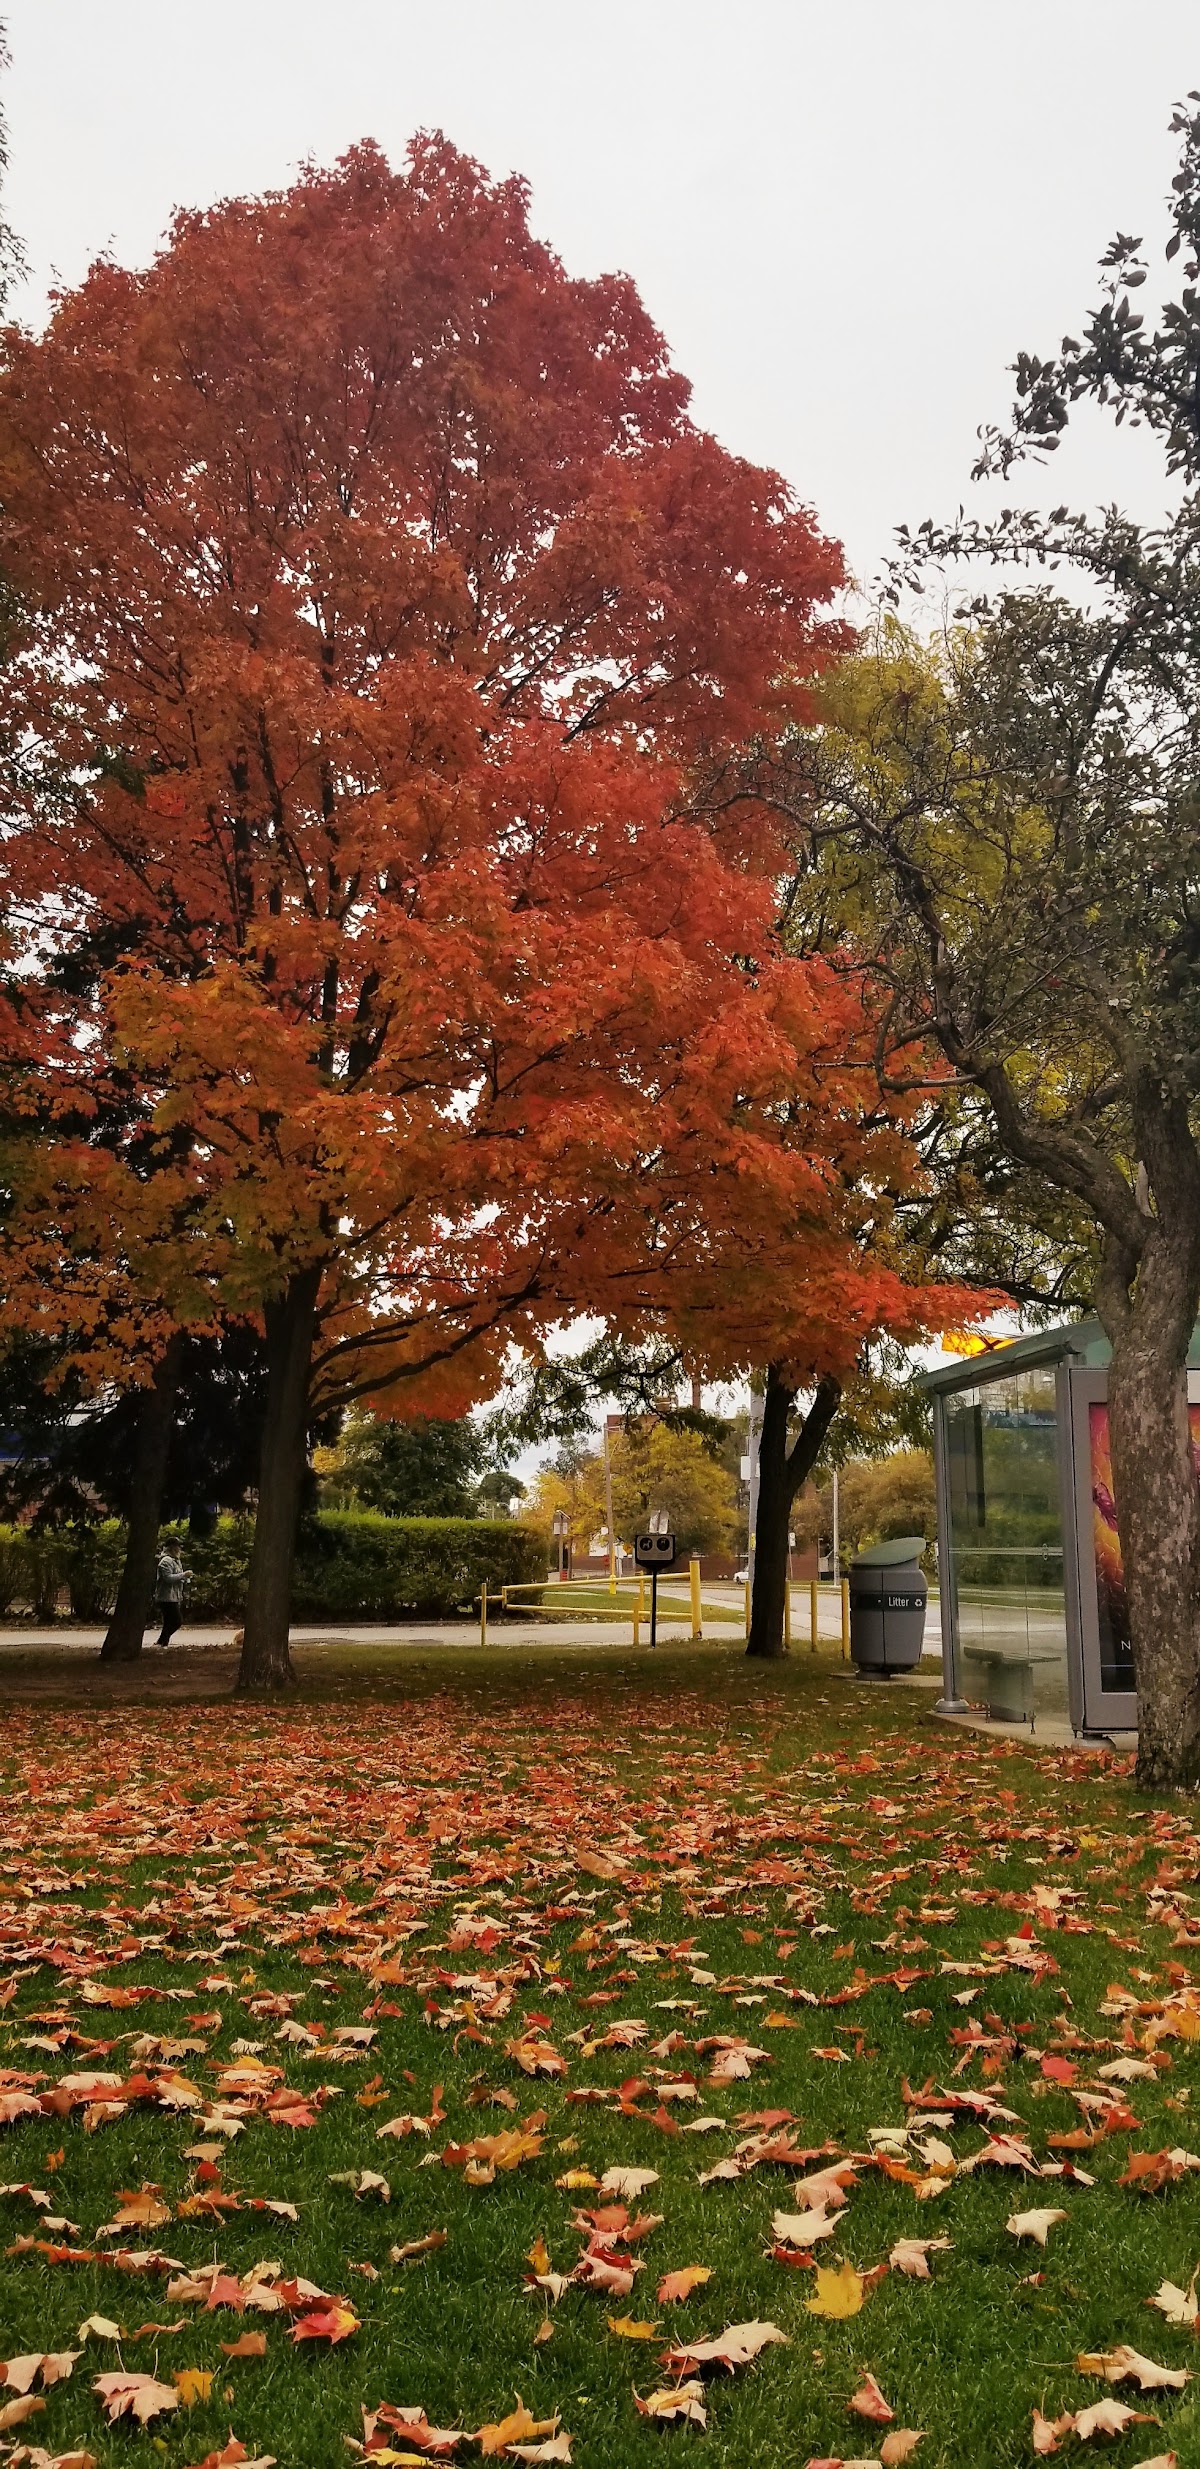
Photo by Javier Rodriguez via Google Places · cached 5/9/2026
Memorial Park - North York scores 41.4 / 100. Strongest dimensions: enclosure / eyes on park and connectivity. Weakest: edge activation (5.5). Border-vacuum risk is elevated (36). This score is a transparent reading of Jane Jacobs-style vitality factors, not a definitive judgment.
Area · 5.43 ha
Weighted across six dimensions · confidence 70%
Scores are not bell-curved. Percentiles and expected scores provide context without changing the underlying model.
Loading map…
The parks map is loading.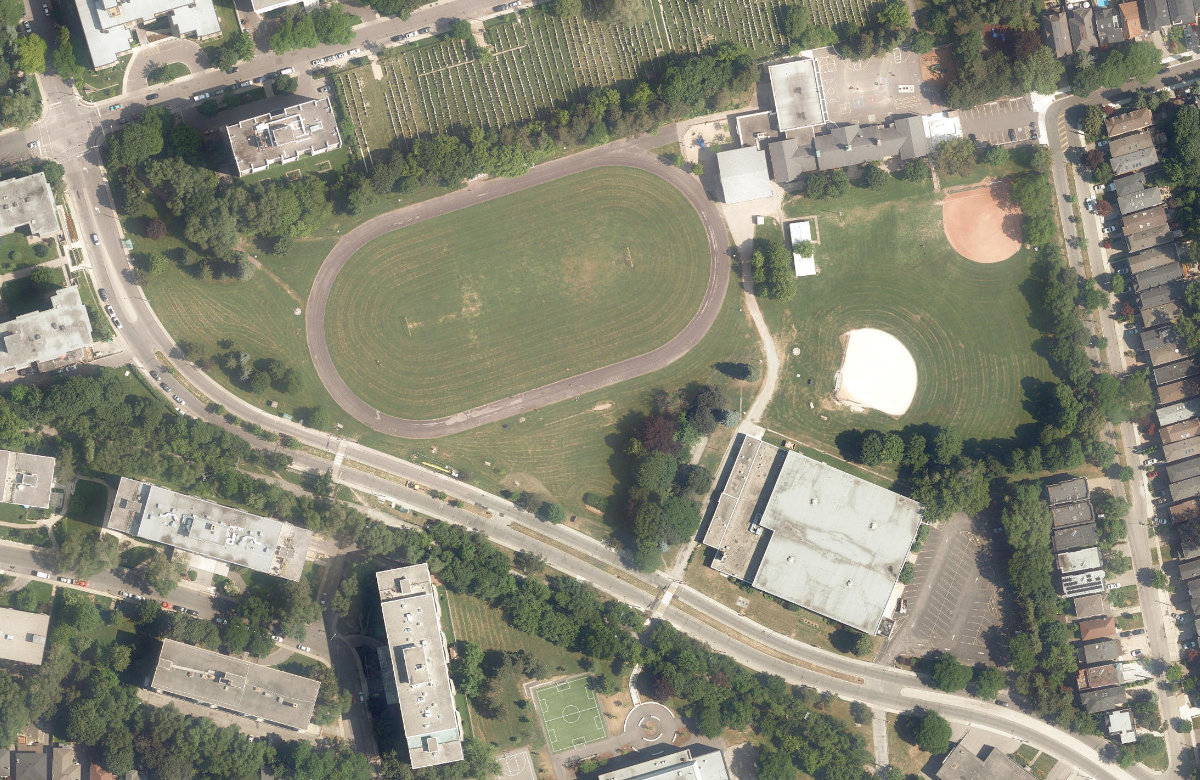
Explain this score
Where did the 41 come from? Each weighted contribution against a neutral 50 baseline. Green = pushed up; red = pulled down.
Sum of contributions = the headline score. A negative bar means that dimension dragged the park below the city-wide neutral baseline.
Why this park works
Memorial Park - North York works because its enclosure score (90) is one of the city's strongest and its amenity diversity (28) is also top decile (53 mid-rise buildings frame the edge with passive surveillance).
What limits this park
Memorial Park - North York's edges are fronted by border-vacuum land uses (highways, rail, parking, blank institutional), risk score 36.
Most distinctive characteristic
Most distinctive feature: exceptionally high enclosure (90, top decile).
Jacobs reading
Memorial Park - North York sits between an urban social park and an ecological retreat: moderately useful for both, exceptionally suited to neither.
Tradeoffs
- Connectivity (65) significantly outpaces natural comfort (40): well placed in the city but offers little shade or ecological respite.
- The park is enclosed by buildings (90) but the surrounding streets are quiet (edge activation 6): frame without animation.
Performance in context
- Citywide rank is high (80th) but typology rank is more modest (59th): the strength likely comes from the dataset average pulling lower than this typology’s baseline.
Typology classification
Classified as Civic Square: name flags as civic square + 11.6 buildings per 100 m frontage. Secondary read: Athletic / Recreation Park (67% of amenity types are athletic (sports_field, track)).
Edge Activation
Within 100 m of the park edge: 5 active uses (transit_stop) and 5 dead/hostile uses (parking_lot). Active edges keep "eyes on the park" through the day; parking lots, blank institutional walls, rail and highway frontages drain street life.
Source: OSM POIs (amenity/shop) + Toronto Building Footprints + land use
Connectivity
Connectivity blends paths, intersections, transit, entrances, and edge density. This park has 5 mapped paths/walkways and 33 sidewalk segments within 50 m; 8 street intersections within 100 m; 30 transit stops within a 400 m walk; 2 estimated access points across ~1,192 m of perimeter. moderate edge density, small superblock penalty applied. Source coverage: centreline, pedestrian_network, transit_osm.
Source: Toronto Centreline V2 + Pedestrian Network + OSM transit stops
Amenity Diversity
3 distinct amenity types in the park (sports_field, track, washroom). Diversity, not raw count, drives the score so a park with many distinct activity types can outrank a larger park that repeats the same use.
Source: Toronto Parks & Recreation Facilities + OSM amenity tags
Natural Comfort
Natural-comfort components for this park: 5.0% estimated tree canopy; 9 city-mapped trees inside the polygon (1.7/ha). Reading: exposed. Source coverage: treed_area, street_trees. Impervious surface is approximated (Toronto's authoritative layer ships only as a raster GeoTIFF).
Source: Toronto Treed Area + Ravine + Waterbodies + Street Tree Inventory
Enclosure / Eyes on Park
138 buildings within 25 m of the park edge (53 mid-rise, 84 low-rise, 1 tower); avg edge height 12.6 m (~4 floors); 11.6 buildings per 100 m of 1,192 m perimeter (strong frontage density); edges are at a Jacobs-scale walkable mid-rise (3 to 7 floors); 1 tower ≥ 40 m within 25 m of the edge. "Eyes on the park" come strongest from the 53 mid-rise edge buildings.
Source: Toronto 3D Massing (building footprints + heights)
Border Vacuum Risk
Border-vacuum factors within 50 m of the park: parking_lot, parking_lot, parking_lot. Jacobs warned that highways, rail, parking lots and blank institutional edges act as "vacuums" that suppress foot traffic and isolate the park from its neighbourhood.
Source: Toronto Street Centreline (highways) + rail layer + OSM landuse + building footprints
Equity Context
Equity Context requires inputs not yet loaded for this park (Toronto Neighbourhood Profiles). Score is held at a neutral 50 with low confidence. Read with caution.
Source: Toronto Neighbourhood Profiles
Amenities (3 types · 3 records)
- sports field
- track
- washroom
Nearby active-edge features (38)
- transit stop0 m
- transit stop0 m
- parking lot0 m
- transit stop1 m
- transit stop19 m
- parking lot20 m
- transit stop: Chaplin Crescent27 m
- parking lot49 m
- parking lot56 m
- parking lot74 m
- parking lot130 m
- transit stop: Spadina Road130 m
- parking lot130 m
- highway: Eglinton Avenue West136 m
- transit stop: Eglinton Avenue West137 m
- highway: Eglinton Avenue West137 m
- parking lot141 m
- highway: Eglinton Avenue West153 m
- highway: Eglinton Avenue West153 m
- transit stop: Chaplin157 m
- parking lot161 m
- transit stop: Spadina Rd at Eglinton Ave W165 m
- transit stop: Chaplin167 m
- transit stop: Spadina Rd at Eglinton Ave W168 m
- transit stop: Roselawn Avenue168 m
- community: Toronto Public Library - Forest Hill169 m
- parking lot175 m
- transit stop: Chaplin176 m
- highway: Eglinton Avenue West178 m
- parking lot185 m
- retail: Tom's Florist186 m
- transit stop: Bathurst Street186 m
- transit stop: Gardiner Road188 m
- transit stop: Vesta Drive190 m
- retail: Guillermo's Creative Hair Studio194 m
- highway: Eglinton Avenue West194 m
- transit stop: Gilgorm Road195 m
- rail: Line 5 Eglinton199 m
Park profile
Five-axis radar across the structural dimensions.
Citywide percentile ranks
Across all Toronto parks in the dataset.
- Overall vitality80th
- Edge activation65th
- Connectivity83th
- Amenity diversity93th
- Natural comfort36th
- Enclosure96th
Most similar parks
Closest in metric space across the five structural dimensions.
- Hideaway ParkUrban Plaza42
- Pricefield Road PlaygroundParkette42
- West Lodge ParkAthletic / Recreation Park41
- Sumach - Shuter ParketteUrban Plaza41
- Joshua Cronkwright ParketteUrban Plaza37
Most opposite parks
Furthest in metric space. Useful for recognising what kind of park this isn’t.
- Toronto Islands - Muggs Island ParkRavine / Naturalized Park25
- Trca Lands ( 26)Ravine / Naturalized Park27
- Rouge ParkWaterfront Park25
- Rouge ParkRavine / Naturalized Park28
- Rouge ParkRavine / Naturalized Park26
Visitor signals
Public attention measured by Google Places aggregates. This proxies attention, not occupancy. Aggregate-only: no usernames, no review text, no extra photos beyond the cached hero.
p32 citywide · p17 within Civic Square
Source: Google Places API · match high (0.94 composite confidence) · last refreshed 5/9/2026. Privacy contract. Measures public attention, not occupancy.
Human activity signals: not available
No activity signals have landed for this park yet. The model has scored its physical form but it can’t yet say how often it’s programmed, photographed, or walked through. See /data-ethics for what we will and will not collect.
Does this score feel accurate?
Your read of Memorial Park - North Yorkmatters. We’re testing whether the model lines up with how people actually use the park. Submissions are stored locally; no account needed.
Tell us how this park feels
We measure structure (canopy, edges, connectivity). You measure feeling. Both matter, and disagreement is itself useful civic data.
What would improve this park?
Generated from the weakest measured dimensions: a starting point, not a prescription.
- Activate the edges: encourage cafés, retail or community uses on the streets that face the park; replace blank or parking-lot edges where possible.
- Diversify what people can do in the park (playground, washroom, water, shade, performance, sport, garden): even small additions raise this score.
- Increase canopy and reduce paved area. Shade and water features extend usable hours and seasons.
- Mitigate border vacuums (highways, rail, parking) with active programming on the still-permeable edges and treat the hostile edge as a design challenge.
Data sources
- City of Toronto Open Data: Parks (Green Space)Polygon boundaries, official names, types.
- Parks & Recreation FacilitiesInventory of in-park amenities (washrooms, fields, rinks…).
- Toronto Pedestrian NetworkSidewalk segments around and through parks; estimated park entrances.
- Toronto Centreline V2Street segments + intersection nodes near park edges; trails and walkways.
- Toronto 3D MassingBuilding footprints + heights for edge-building counts, frontage density, and tower-in-the-park risk.
- Toronto Treed AreaTree canopy share inside park polygons via stratified-grid sampling.
- Toronto Waterbodies & RiversWater surface inside parks + nearest-water distance for cooling.
- Ravine & Natural Feature ProtectionRavine overlap as a cooling / natural-comfort signal.
- Toronto Street Tree InventoryTree count + density inside park polygons.
- Neighbourhood Profiles(Pending) Equity context proxy.
- OpenStreetMap (Overpass API)Cafés, restaurants, retail, transit stops, parking, highways, rail.