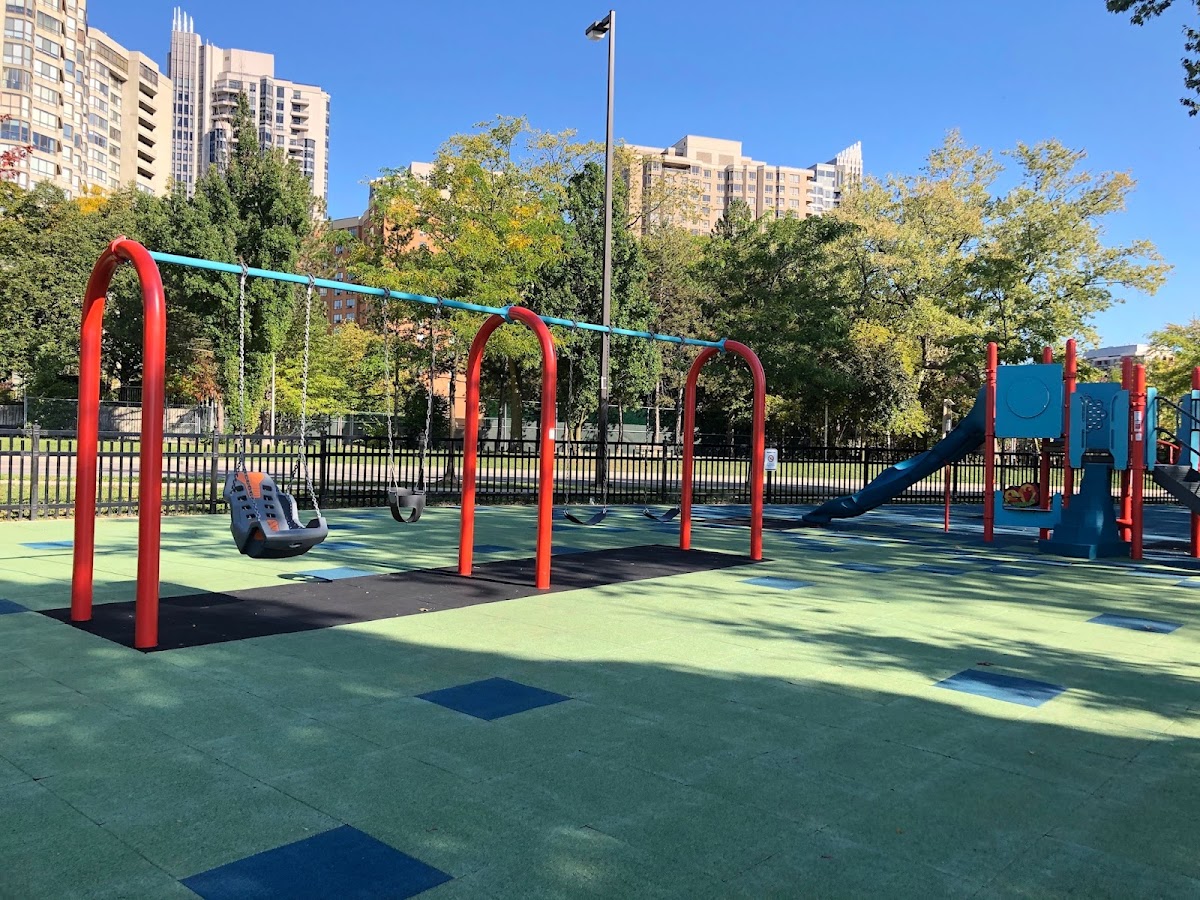
Kempford Parkette
Corridor / Linear Park, in the top tier overall (score 45, rank ~89th percentile). Strongest: connectivity; weakest: edge activation.
Photo by Janice Wong via Google Places · cached 5/9/2026
Kempford Parkette scores 44.7 / 100. Strongest dimensions: enclosure / eyes on park and connectivity. Weakest: amenity diversity (0). Border-vacuum risk is low. This score is a transparent reading of Jane Jacobs-style vitality factors, not a definitive judgment.
Area · 0.66 ha
Weighted across six dimensions · confidence 63%
Scores are not bell-curved. Percentiles and expected scores provide context without changing the underlying model.
Loading map…
The parks map is loading.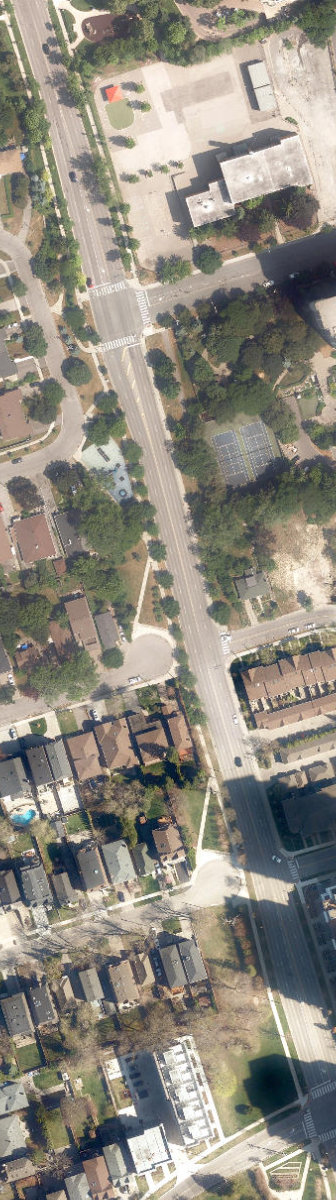
Explain this score
Where did the 45 come from? Each weighted contribution against a neutral 50 baseline. Green = pushed up; red = pulled down.
Sum of contributions = the headline score. A negative bar means that dimension dragged the park below the city-wide neutral baseline.
Why this park works
Kempford Parkette works because its connectivity score (80) is one of the city's strongest and its enclosure (87) is also top decile (21 transit stops sit within a 400 m walk; 22 intersections fall within 100 m of the edge).
What limits this park
Kempford Parkette doesn't have a clear weakness. Every measured dimension is at or above the middle of the pack.
Most distinctive characteristic
Most distinctive feature: exceptionally high connectivity (80, top decile).
Jacobs reading
Kempford Parkette sits between an urban social park and an ecological retreat: moderately useful for both, exceptionally suited to neither.
Tradeoffs
- The park is enclosed by buildings (87) but the surrounding streets are quiet (edge activation 0): frame without animation.
Performance in context
- This park is a strong overperformer for its cohort: raw 45 versus an expected 32 for similar parks (small Corridor / Linear Park) (gap +12).
Typology classification
Classified as Corridor / Linear Park: shape elongation 3.4× a circle of equal area
Edge Activation
Within 100 m of the park edge: 0 active uses (none) and 1 dead/hostile uses (parking_lot). Active edges keep "eyes on the park" through the day; parking lots, blank institutional walls, rail and highway frontages drain street life.
Source: OSM POIs (amenity/shop) + Toronto Building Footprints + land use
Connectivity
Connectivity blends paths, intersections, transit, entrances, and edge density. This park has 12 mapped paths/walkways and 40 sidewalk segments within 50 m; 22 street intersections within 100 m; 21 transit stops within a 400 m walk; 17 estimated access points across ~979 m of perimeter. edge density is healthy, no superblock penalty. Source coverage: centreline, pedestrian_network, transit_osm.
Source: Toronto Centreline V2 + Pedestrian Network + OSM transit stops
Amenity Diversity
No amenities recorded. Score is 0 until inventory is loaded.
Source: Toronto Parks & Recreation Facilities + OSM amenity tags
Natural Comfort
Natural-comfort components for this park: ~63.0% effective canopy (2.2% from contiguous tree polygons + scattered tree density); nearest waterbody ~1416 m; 90 city-mapped trees inside the polygon (90.0/ha). Reading: well-shaded. Source coverage: treed_area, waterbodies, street_trees. Impervious surface is approximated (Toronto's authoritative layer ships only as a raster GeoTIFF).
Source: Toronto Treed Area + Ravine + Waterbodies + Street Tree Inventory
Enclosure / Eyes on Park
117 buildings within 25 m of the park edge (37 mid-rise, 66 low-rise, 14 tower); avg edge height 14.0 m (~5 floors); 12.0 buildings per 100 m of 979 m perimeter (strong frontage density); edges are at a Jacobs-scale walkable mid-rise (3 to 7 floors); 14 towers ≥ 40 m within 25 m of the edge. "Eyes on the park" come strongest from the 37 mid-rise edge buildings.
Source: Toronto 3D Massing (building footprints + heights)
Border Vacuum Risk
Park edges face the city. No significant border vacuum detected.
Source: Toronto Street Centreline (highways) + rail layer + OSM landuse + building footprints
Equity Context
Equity Context requires inputs not yet loaded for this park (Toronto Neighbourhood Profiles). Score is held at a neutral 50 with low confidence. Read with caution.
Source: Toronto Neighbourhood Profiles
Amenities (0)
No amenities recorded for this park.
Nearby active-edge features (55)
- parking lot96 m
- parking lot102 m
- parking lot116 m
- parking lot: Fire and Ambulance Parking120 m
- parking lot134 m
- parking lot140 m
- parking lot144 m
- retail: Danmi Nails & Brows148 m
- parking lot149 m
- retail: La La Wellness Centre149 m
- parking lot150 m
- parking lot156 m
- retail: Koko Hair Salon160 m
- parking lot160 m
- parking lot162 m
- parking lot162 m
- parking lot163 m
- parking lot164 m
- cafe: Royaltea167 m
- restaurant: Hot Impression168 m
- restaurant: Superhot168 m
- parking lot169 m
- retail: The OWL’s Meat Shop169 m
- parking lot169 m
- retail: N Hair Salon169 m
- parking lot171 m
- retail: Haiwai Travel173 m
- retail: Luna Bakery174 m
- transit stop: Yonge Street at Churchill Avenue177 m
- parking lot177 m
- transit stop: Yonge St. @ Churchill Ave.177 m
- parking lot180 m
- retail: Hair I Am Studio180 m
- restaurant: Oh Geul Boh Geul Korean Restaurant180 m
- restaurant: Hui Lau Shan185 m
- restaurant: Bowl Bowl185 m
- restaurant: DakGoGi187 m
- restaurant: i-migo187 m
- retail: Celebrity Hair Stylist188 m
- retail: Bruce Hairstylist188 m
- retail: Lisa’s Nails Spa188 m
- retail: DigitM189 m
- restaurant: Zhang's Kitchen 张小厨189 m
- retail: Pink Lipstick Beauty Supply189 m
- retail: Central Vape City189 m
- retail: Pumpkin Clothing and Accessories190 m
- retail: KC Tour190 m
- retail: Sun Hair Salon190 m
- restaurant: My Sushi190 m
- restaurant: Crystal Palace190 m
- restaurant: San Tong191 m
- restaurant: Ai Taiker191 m
- highway: Yonge Street192 m
- transit stop: Yonge Street at Horsham Avenue193 m
- parking lot199 m
Park profile
Five-axis radar across the structural dimensions.
Citywide percentile ranks
Across all Toronto parks in the dataset.
- Overall vitality89th
- Edge activation42th
- Connectivity99th
- Amenity diversity48th
- Natural comfort81th
- Enclosure93th
Most similar parks
Closest in metric space across the five structural dimensions.
- Kay Gardner Beltline ParkRavine / Naturalized Park35
- Alexander Muir Memorial GardensCivic Square33
- Ring Road Linear ParkCorridor / Linear Park36
- Mount Pleasant CemeteryOther36
- Brookdale ParkRavine / Naturalized Park43
Most opposite parks
Furthest in metric space. Useful for recognising what kind of park this isn’t.
- Rouge ParkRavine / Naturalized Park18
- Rouge ParkRavine / Naturalized Park21
- Trca Lands ( 58)Waterfront Park18
- Toronto Islands - Island ParkWaterfront Park52
- Queen'S Quay Traffic IslandWaterfront Park49
Visitor signals
Public attention measured by Google Places aggregates. This proxies attention, not occupancy. Aggregate-only: no usernames, no review text, no extra photos beyond the cached hero.
p24 citywide · p39 within Corridor / Linear Park
Source: Google Places API · match high (0.95 composite confidence) · last refreshed 5/9/2026. Privacy contract. Measures public attention, not occupancy.
Human activity signals: not available
No activity signals have landed for this park yet. The model has scored its physical form but it can’t yet say how often it’s programmed, photographed, or walked through. See /data-ethics for what we will and will not collect.
Does this score feel accurate?
Your read of Kempford Parkettematters. We’re testing whether the model lines up with how people actually use the park. Submissions are stored locally; no account needed.
Tell us how this park feels
We measure structure (canopy, edges, connectivity). You measure feeling. Both matter, and disagreement is itself useful civic data.
What would improve this park?
Generated from the weakest measured dimensions: a starting point, not a prescription.
- Activate the edges: encourage cafés, retail or community uses on the streets that face the park; replace blank or parking-lot edges where possible.
- Diversify what people can do in the park (playground, washroom, water, shade, performance, sport, garden): even small additions raise this score.
Data sources
- City of Toronto Open Data: Parks (Green Space)Polygon boundaries, official names, types.
- Parks & Recreation FacilitiesInventory of in-park amenities (washrooms, fields, rinks…).
- Toronto Pedestrian NetworkSidewalk segments around and through parks; estimated park entrances.
- Toronto Centreline V2Street segments + intersection nodes near park edges; trails and walkways.
- Toronto 3D MassingBuilding footprints + heights for edge-building counts, frontage density, and tower-in-the-park risk.
- Toronto Treed AreaTree canopy share inside park polygons via stratified-grid sampling.
- Toronto Waterbodies & RiversWater surface inside parks + nearest-water distance for cooling.
- Ravine & Natural Feature ProtectionRavine overlap as a cooling / natural-comfort signal.
- Toronto Street Tree InventoryTree count + density inside park polygons.
- Neighbourhood Profiles(Pending) Equity context proxy.
- OpenStreetMap (Overpass API)Cafés, restaurants, retail, transit stops, parking, highways, rail.