Dentonia Park
Athletic / Recreation Park, in the top tier overall (score 47, rank ~92th percentile). Strongest: amenity diversity; weakest: natural comfort.
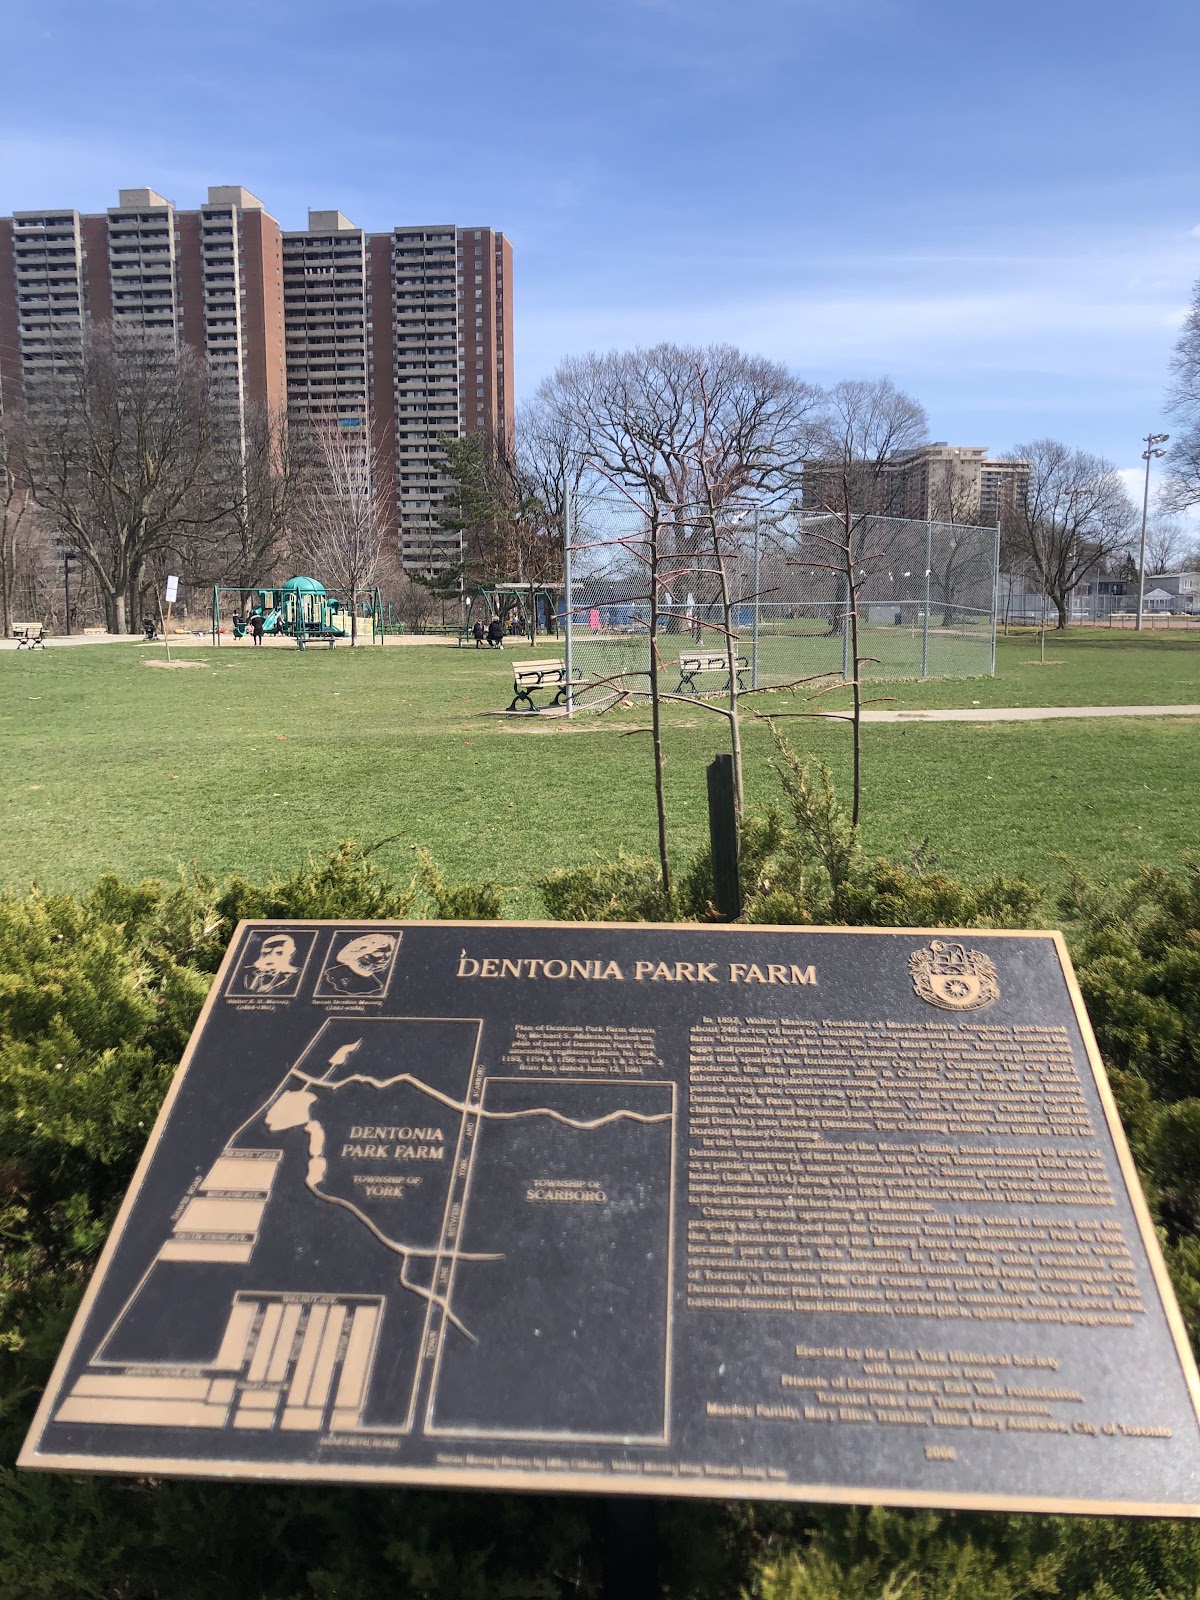
Photo by Diane Begin via Google Places · cached 5/9/2026
Dentonia Park scores 46.9 / 100. Strongest dimensions: connectivity and enclosure / eyes on park. Weakest: edge activation (20.4). Border-vacuum risk is elevated (84). This score is a transparent reading of Jane Jacobs-style vitality factors, not a definitive judgment.
Area · 6.19 ha
Weighted across six dimensions · confidence 72%
Scores are not bell-curved. Percentiles and expected scores provide context without changing the underlying model.
Loading map…
The parks map is loading.
Explain this score
Where did the 47 come from? Each weighted contribution against a neutral 50 baseline. Green = pushed up; red = pulled down.
Sum of contributions = the headline score. A negative bar means that dimension dragged the park below the city-wide neutral baseline.
Why this park works
Dentonia Park works because its amenity diversity score (44) is one of the city's strongest and its connectivity (80) is also top decile (6 distinct amenity types support different kinds of use).
What limits this park
Dentonia Park's edges are fronted by border-vacuum land uses (highways, rail, parking, blank institutional), risk score 84.
Most distinctive characteristic
Most distinctive feature: exceptionally high amenity diversity (44, top decile).
Jacobs reading
Dentonia Park sits between an urban social park and an ecological retreat: moderately useful for both, exceptionally suited to neither.
Tradeoffs
- Connectivity (80) significantly outpaces natural comfort (50): well placed in the city but offers little shade or ecological respite.
- The park is enclosed by buildings (78) but the surrounding streets are quiet (edge activation 20): frame without animation.
- 5 nearby towers cast wind and shadow without contributing canopy: passive surveillance is plentiful but human-scale comfort is not.
- High connectivity coexists with high border-vacuum risk (84): much of that connectivity is to highways, rail, or parking lots, not to neighbourhoods.
Performance in context
- A modest overperformer for its athletic / recreation park typology (+5 vs the median in Athletic / Recreation Park).
- Citywide rank is high (92nd) but typology rank is more modest (72nd): the strength likely comes from the dataset average pulling lower than this typology’s baseline.
Typology classification
Classified as Athletic / Recreation Park: 50% of amenity types are athletic (basketball, sports_field, tennis). Secondary read: Neighbourhood Park (6.2 ha, framed by 19 mid-rise vs 5 towers).
Edge Activation
Within 100 m of the park edge: 13 active uses (transit_stop) and 6 dead/hostile uses (rail, parking_lot). Active edges keep "eyes on the park" through the day; parking lots, blank institutional walls, rail and highway frontages drain street life.
Source: OSM POIs (amenity/shop) + Toronto Building Footprints + land use
Connectivity
Connectivity blends paths, intersections, transit, entrances, and edge density. This park has 16 mapped paths/walkways and 60 sidewalk segments within 50 m; 21 street intersections within 100 m; 45 transit stops within a 400 m walk; 11 estimated access points across ~1,513 m of perimeter. edge density is healthy, no superblock penalty. Source coverage: centreline, pedestrian_network, transit_osm.
Source: Toronto Centreline V2 + Pedestrian Network + OSM transit stops
Amenity Diversity
6 distinct amenity types in the park (basketball, picnic, playground, sports_field, tennis, washroom). Diversity, not raw count, drives the score so a park with many distinct activity types can outrank a larger park that repeats the same use.
Source: Toronto Parks & Recreation Facilities + OSM amenity tags
Natural Comfort
Natural-comfort components for this park: 4.6% estimated tree canopy; 22.2% inside the ravine system; nearest waterbody ~452 m; 31 city-mapped trees inside the polygon (5.0/ha). Reading: exposed. Source coverage: treed_area, ravine, waterbodies, street_trees. Impervious surface is approximated (Toronto's authoritative layer ships only as a raster GeoTIFF).
Source: Toronto Treed Area + Ravine + Waterbodies + Street Tree Inventory
Enclosure / Eyes on Park
189 buildings within 25 m of the park edge (19 mid-rise, 165 low-rise, 5 tower); avg edge height 8.8 m (~3 floors); 12.5 buildings per 100 m of 1,513 m perimeter (strong frontage density); edges are low-rise (mostly 2 to 3 floors); 5 towers ≥ 40 m within 25 m of the edge. "Eyes on the park" come strongest from the 19 mid-rise edge buildings.
Source: Toronto 3D Massing (building footprints + heights)
Border Vacuum Risk
Border-vacuum factors within 50 m of the park: Bloor-Danforth Line, parking_lot, Bloor-Danforth Line, Bloor-Danforth Line, Bloor-Danforth Line. Jacobs warned that highways, rail, parking lots and blank institutional edges act as "vacuums" that suppress foot traffic and isolate the park from its neighbourhood.
Source: Toronto Street Centreline (highways) + rail layer + OSM landuse + building footprints
Equity Context
Equity Context requires inputs not yet loaded for this park (Toronto Neighbourhood Profiles). Score is held at a neutral 50 with low confidence. Read with caution.
Source: Toronto Neighbourhood Profiles
Amenities (6 types · 7 records)
- basketball
- picnic
- playground
- sports field
- tennis
- washroom
Nearby active-edge features (59)
- rail: Bloor-Danforth Line0 m
- rail: Bloor-Danforth Line0 m
- parking lot4 m
- transit stop: Denton Avenue10 m
- rail: Bloor-Danforth Line25 m
- rail: Bloor-Danforth Line28 m
- transit stop30 m
- transit stop: Crescent Town Bridge41 m
- transit stop: Victoria Park Avenue43 m
- transit stop: Victoria Park Station48 m
- transit stop: Denton Avenue51 m
- transit stop: North Walkway53 m
- transit stop: Victoria Park Station90 m
- transit stop: Victoria Park Station90 m
- transit stop: Victoria Park Station90 m
- transit stop: Victoria Park Station90 m
- transit stop91 m
- transit stop: Victoria Park96 m
- parking lot98 m
- transit stop: Albion Avenue104 m
- transit stop: Victoria Park108 m
- parking lot111 m
- parking lot117 m
- rail: Bloor-Danforth Line122 m
- rail: Bloor-Danforth Line124 m
- parking lot136 m
- parking lot138 m
- parking lot146 m
- transit stop: Goodwood Park Court167 m
- transit stop: Dawes Rd at Second Ave167 m
- retail169 m
- parking lot174 m
- transit stop: Secord Avenue174 m
- parking lot175 m
- retail: Cannabis Place175 m
- parking lot: Toronto Transit Commission - East Lot177 m
- retail: Michel Le Nail179 m
- transit stop: Macey Avenue179 m
- retail: Vision Clear Optical180 m
- transit stop: Danforth Avenue181 m
- retail: Superior Tire & Auto182 m
- restaurant: Dhaka Kebab183 m
- retail: Money Mart183 m
- retail: Dawes & Secord Convenience184 m
- restaurant: Radhuni Pizza & Grill188 m
- parking lot189 m
- transit stop: Dawes Rd at Dentonia Park Ave189 m
- transit stop: Dawes Rd at Dentonia Park Ave189 m
- retail: Topin Hair Salon190 m
- transit stop: Victoria Park Avenue191 m
- retail: Chowk Bazaar192 m
- retail: Ababeel Supermarket193 m
- parking lot196 m
- retail196 m
- parking lot197 m
- retail: Imag Convenience Store198 m
- parking lot199 m
- highway: Danforth Avenue199 m
- parking lot200 m
Park profile
Five-axis radar across the structural dimensions.
Citywide percentile ranks
Across all Toronto parks in the dataset.
- Overall vitality92th
- Edge activation78th
- Connectivity99th
- Amenity diversity99th
- Natural comfort59th
- Enclosure81th
Most similar parks
Closest in metric space across the five structural dimensions.
- Edithvale ParkCorridor / Linear Park49
- Stan Wadlow ParkNeighbourhood Park52
- Little Norway ParkNeighbourhood Park53
- Baird ParkParkette55
- Moss ParkAthletic / Recreation Park49
Most opposite parks
Furthest in metric space. Useful for recognising what kind of park this isn’t.
- Toronto Islands - Muggs Island ParkRavine / Naturalized Park25
- Trca Lands ( 26)Ravine / Naturalized Park27
- Rouge ParkRavine / Naturalized Park21
- Rouge ParkRavine / Naturalized Park26
- Rouge ParkWaterfront Park25
Visitor signals
Public attention measured by Google Places aggregates. This proxies attention, not occupancy. Aggregate-only: no usernames, no review text, no extra photos beyond the cached hero.
“Park with soccer & cricket fields a baseball diamond, basketball court, playground & splash pad.” (Google editorial summary)
p92 citywide · p94 within Athletic / Recreation Park
Source: Google Places API · match high (0.98 composite confidence) · last refreshed 5/9/2026. Privacy contract. Measures public attention, not occupancy.
Human activity signals: not available
No activity signals have landed for this park yet. The model has scored its physical form but it can’t yet say how often it’s programmed, photographed, or walked through. See /data-ethics for what we will and will not collect.
Does this score feel accurate?
Your read of Dentonia Parkmatters. We’re testing whether the model lines up with how people actually use the park. Submissions are stored locally; no account needed.
Tell us how this park feels
We measure structure (canopy, edges, connectivity). You measure feeling. Both matter, and disagreement is itself useful civic data.
What would improve this park?
Generated from the weakest measured dimensions: a starting point, not a prescription.
- Activate the edges: encourage cafés, retail or community uses on the streets that face the park; replace blank or parking-lot edges where possible.
- Diversify what people can do in the park (playground, washroom, water, shade, performance, sport, garden): even small additions raise this score.
- Increase canopy and reduce paved area. Shade and water features extend usable hours and seasons.
- Mitigate border vacuums (highways, rail, parking) with active programming on the still-permeable edges and treat the hostile edge as a design challenge.
Data sources
- City of Toronto Open Data: Parks (Green Space)Polygon boundaries, official names, types.
- Parks & Recreation FacilitiesInventory of in-park amenities (washrooms, fields, rinks…).
- Toronto Pedestrian NetworkSidewalk segments around and through parks; estimated park entrances.
- Toronto Centreline V2Street segments + intersection nodes near park edges; trails and walkways.
- Toronto 3D MassingBuilding footprints + heights for edge-building counts, frontage density, and tower-in-the-park risk.
- Toronto Treed AreaTree canopy share inside park polygons via stratified-grid sampling.
- Toronto Waterbodies & RiversWater surface inside parks + nearest-water distance for cooling.
- Ravine & Natural Feature ProtectionRavine overlap as a cooling / natural-comfort signal.
- Toronto Street Tree InventoryTree count + density inside park polygons.
- Neighbourhood Profiles(Pending) Equity context proxy.
- OpenStreetMap (Overpass API)Cafés, restaurants, retail, transit stops, parking, highways, rail.