Mel Lastman Square
Civic Square, near the bottom of the city overall (score 24, rank ~10th percentile). Strongest: enclosure; weakest: edge activation.
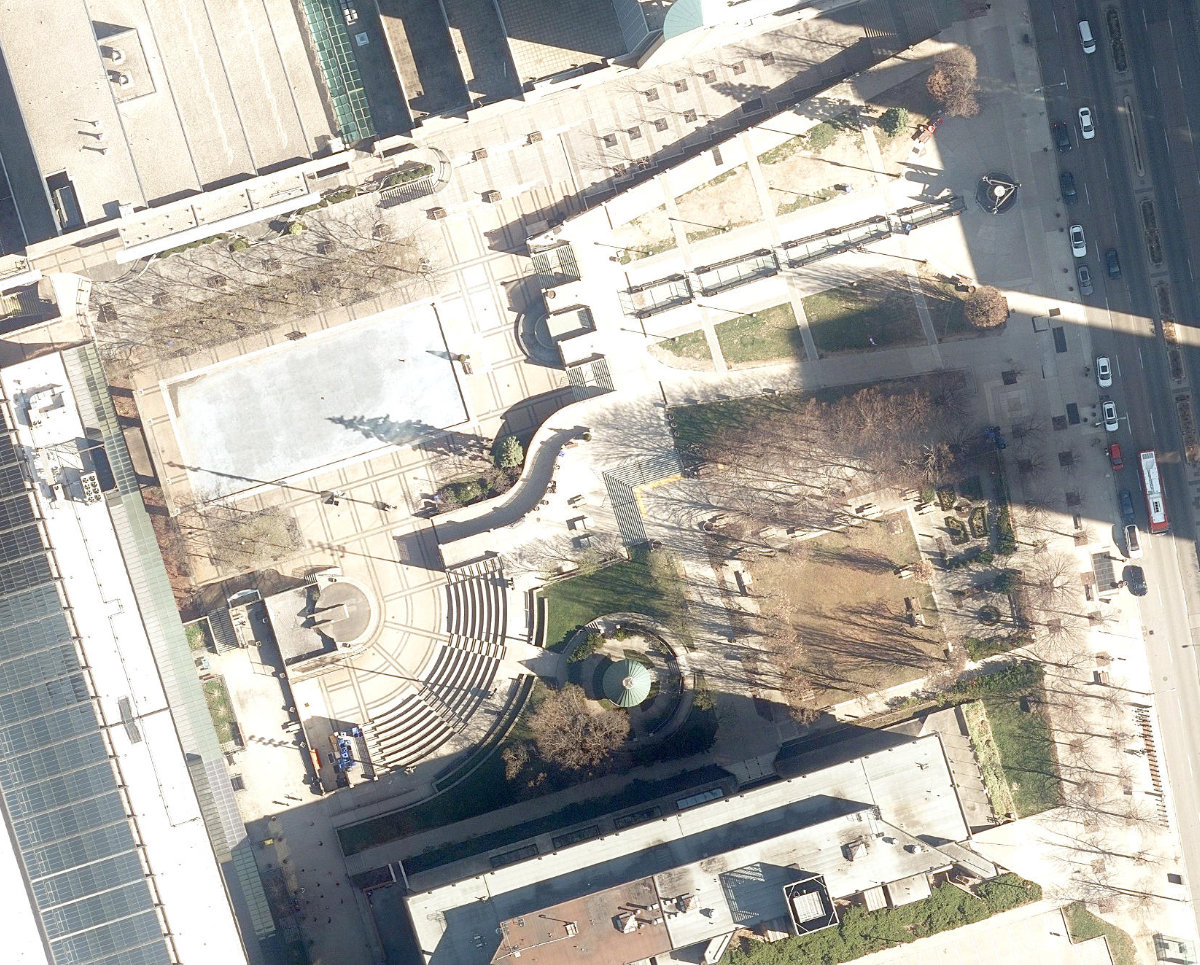
Aerial, City of Toronto orthophoto, ~8 cm/px source · cached 5/9/2026
Mel Lastman Square scores 24.1 / 100. Strongest dimensions: enclosure / eyes on park and connectivity. Weakest: amenity diversity (0). Border-vacuum risk is elevated (100). This score is a transparent reading of Jane Jacobs-style vitality factors, not a definitive judgment.
Area · 1.09 ha
Weighted across six dimensions · confidence 59%
Scores are not bell-curved. Percentiles and expected scores provide context without changing the underlying model.
Loading map…
The parks map is loading.Explain this score
Where did the 24 come from? Each weighted contribution against a neutral 50 baseline. Green = pushed up; red = pulled down.
Sum of contributions = the headline score. A negative bar means that dimension dragged the park below the city-wide neutral baseline.
Why this park works
Mel Lastman Square works because its enclosure score (71) is middle of the pack (26 mid-rise buildings frame the edge with passive surveillance).
What limits this park
Mel Lastman Square is held back by edge activation (0, below-average): the surrounding streets carry too few active uses to spill into the park; border-vacuum risk is also elevated (100).
Most distinctive characteristic
Most distinctive feature: exceptionally low edge activation (0, below-average).
Jacobs reading
Mel Lastman Square sits between an urban social park and an ecological retreat: moderately useful for both, exceptionally suited to neither.
Tradeoffs
- The park is enclosed by buildings (71) but the surrounding streets are quiet (edge activation 0): frame without animation.
- 6 nearby towers cast wind and shadow without contributing canopy: passive surveillance is plentiful but human-scale comfort is not.
Performance in context
- Strong underperformer relative to its cohort: raw 24 vs an expected 39 (gap -15).
Typology classification
Classified as Civic Square: name flags as civic square + 33 buildings frame the edge. Secondary read: Neighbourhood Park (1.1 ha, framed by 26 mid-rise vs 6 towers).
Edge Activation
Within 100 m of the park edge: 43 active uses (community, cafe, transit_stop, retail, restaurant) and 13 dead/hostile uses (highway, parking_lot). Active edges keep "eyes on the park" through the day; parking lots, blank institutional walls, rail and highway frontages drain street life.
Source: OSM POIs (amenity/shop) + Toronto Building Footprints + land use
Connectivity
Connectivity blends paths, intersections, transit, entrances, and edge density. This park has 0 mapped paths/walkways and 12 sidewalk segments within 50 m; 2 street intersections within 100 m; 12 transit stops within a 400 m walk; 2 estimated access points across ~432 m of perimeter. moderate edge density, small superblock penalty applied. Source coverage: centreline, pedestrian_network, transit_osm.
Source: Toronto Centreline V2 + Pedestrian Network + OSM transit stops
Amenity Diversity
No amenities recorded. Score is 0 until inventory is loaded.
Source: Toronto Parks & Recreation Facilities + OSM amenity tags
Natural Comfort
Natural-comfort components for this park: ~15.4% effective canopy (0.0% from contiguous tree polygons + scattered tree density); nearest waterbody ~1085 m; 24 city-mapped trees inside the polygon (21.9/ha). Reading: exposed. Source coverage: waterbodies, street_trees. Impervious surface is approximated (Toronto's authoritative layer ships only as a raster GeoTIFF).
Source: Toronto Treed Area + Ravine + Waterbodies + Street Tree Inventory
Enclosure / Eyes on Park
33 buildings within 25 m of the park edge (26 mid-rise, 1 low-rise, 6 tower); avg edge height 35.6 m (~12 floors); 7.6 buildings per 100 m of 432 m perimeter (strong frontage density); edges lean tall but still framed; 6 towers ≥ 40 m within 25 m of the edge. "Eyes on the park" come strongest from the 26 mid-rise edge buildings.
Source: Toronto 3D Massing (building footprints + heights)
Border Vacuum Risk
Border-vacuum factors within 50 m of the park: Yonge Street, Yonge Street, Yonge Street, Yonge Street, parking_lot, parking_lot, parking_lot. Jacobs warned that highways, rail, parking lots and blank institutional edges act as "vacuums" that suppress foot traffic and isolate the park from its neighbourhood.
Source: Toronto Street Centreline (highways) + rail layer + OSM landuse + building footprints
Equity Context
Equity Context requires inputs not yet loaded for this park (Toronto Neighbourhood Profiles). Score is held at a neutral 50 with low confidence. Read with caution.
Source: Toronto Neighbourhood Profiles
Amenities (0)
No amenities recorded for this park.
Nearby active-edge features (80)
- transit stop: Yonge St. @ North York Blvd. (Mel Lastman Square)17 m
- cafe: Starbucks20 m
- transit stop: Mel Lastman Square Entrance21 m
- highway: Yonge Street25 m
- transit stop: Yonge Street at Hillcrest Avenue25 m
- highway: Yonge Street29 m
- retail: Book Ends37 m
- parking lot37 m
- retail: Designer Row42 m
- restaurant: Petit Potato43 m
- highway: Yonge Street43 m
- retail: Flight Centre44 m
- parking lot44 m
- parking lot44 m
- retail: Value Mobile48 m
- transit stop: Yonge Street at North York Boulevard49 m
- retail: Stock Up Market49 m
- transit stop: Empress Walk Entrance50 m
- highway: Yonge Street50 m
- community: Toronto Public Library - North York Central Library50 m
- restaurant: California Thai53 m
- retail: Yamaha Music School54 m
- restaurant: Wendy's59 m
- retail: Ardene62 m
- retail: La Memoire64 m
- transit stop: North York Centre64 m
- restaurant: Pho Anh Vu64 m
- restaurant: Villa Fruit64 m
- restaurant: Cafe Palma65 m
- transit stop: North York Centre66 m
- cafe: Second Cup66 m
- retail: Midnight Sun Tanning Salon66 m
- restaurant: La Prep66 m
- retail: Dollarama66 m
- restaurant69 m
- restaurant: Konjiki Ramen69 m
- retail: Palm Tree71 m
- transit stop: North York City Centre Entrance75 m
- parking lot79 m
- retail: LCBO81 m
- retail: Optic Creations82 m
- highway: Yonge Street82 m
- retail: Jazz Casuals83 m
- parking lot84 m
- retail: Fido86 m
- retail: Quattro Boutique86 m
- retail: Empress Optical86 m
- retail: Geneva Fine Jewellery & Watches86 m
- retail: City Centre Convenience89 m
- parking lot89 m
- retail91 m
- retail: Shefield & Sons91 m
- parking lot93 m
- retail: Centrestage Hair Design & Beauty Products94 m
- cafe: Centre Cafe97 m
- parking lot100 m
- retail: Mumuso100 m
- retail: Walking on a Cloud102 m
- cafe: Second Cup103 m
- restaurant: Trio 3107 m
- transit stop: Yonge Street at Elmwood Avenue113 m
- restaurant: Morals Village115 m
- parking lot115 m
- transit stop: Yonge Street at Empress Avenue115 m
- retail: PetSmart120 m
- parking lot120 m
- restaurant: Cafe Landwer123 m
- parking lot126 m
- cafe: Ten Ren's Tea134 m
- retail: Vermillion Medical Spa142 m
- parking lot143 m
- restaurant: Pizzeria Libretto144 m
- highway: Yonge Street147 m
- cafe: Aroma Espresso Bar148 m
- transit stop: Yonge Street at Park Home Avenue149 m
- parking lot153 m
- restaurant: Chipotle159 m
- retail: Taya161 m
- parking lot165 m
- retail: Sleep Country177 m
Park profile
Five-axis radar across the structural dimensions.
Citywide percentile ranks
Across all Toronto parks in the dataset.
- Overall vitality10th
- Edge activation28th
- Connectivity54th
- Amenity diversity37th
- Natural comfort55th
- Enclosure70th
Most similar parks
Closest in metric space across the five structural dimensions.
- Humber River WatercourseWaterfront Park33
- City Wide Open SpaceParkette34
- PORTAGE TRAIL JUNIOR ELEMENTARY SCHOOL - Building GroundsNeighbourhood Park31
- Manor ParkTower-Community Green Space28
- Manor ParkTower-Community Green Space28
Most opposite parks
Furthest in metric space. Useful for recognising what kind of park this isn’t.
- Kew GardensNeighbourhood Park71
- Leslie Grove ParkParkette68
- Bellevue Square ParkCivic Square66
- Market Lane ParkUrban Plaza63
- ALEX WILSON COMMUNITY GARDEN - Open Green SpaceUrban Plaza59
Human activity signals: not available
No activity signals have landed for this park yet. The model has scored its physical form but it can’t yet say how often it’s programmed, photographed, or walked through. See /data-ethics for what we will and will not collect.
Does this score feel accurate?
Your read of Mel Lastman Squarematters. We’re testing whether the model lines up with how people actually use the park. Submissions are stored locally; no account needed.
Tell us how this park feels
We measure structure (canopy, edges, connectivity). You measure feeling. Both matter, and disagreement is itself useful civic data.
What would improve this park?
Generated from the weakest measured dimensions: a starting point, not a prescription.
- Activate the edges: encourage cafés, retail or community uses on the streets that face the park; replace blank or parking-lot edges where possible.
- Add or open more entrances and improve sidewalk continuity around the park. More permeability means more spontaneous use.
- Diversify what people can do in the park (playground, washroom, water, shade, performance, sport, garden): even small additions raise this score.
- Increase canopy and reduce paved area. Shade and water features extend usable hours and seasons.
- Mitigate border vacuums (highways, rail, parking) with active programming on the still-permeable edges and treat the hostile edge as a design challenge.
Data sources
- City of Toronto Open Data: Parks (Green Space)Polygon boundaries, official names, types.
- Parks & Recreation FacilitiesInventory of in-park amenities (washrooms, fields, rinks…).
- Toronto Pedestrian NetworkSidewalk segments around and through parks; estimated park entrances.
- Toronto Centreline V2Street segments + intersection nodes near park edges; trails and walkways.
- Toronto 3D MassingBuilding footprints + heights for edge-building counts, frontage density, and tower-in-the-park risk.
- Toronto Treed AreaTree canopy share inside park polygons via stratified-grid sampling.
- Toronto Waterbodies & RiversWater surface inside parks + nearest-water distance for cooling.
- Ravine & Natural Feature ProtectionRavine overlap as a cooling / natural-comfort signal.
- Toronto Street Tree InventoryTree count + density inside park polygons.
- Neighbourhood Profiles(Pending) Equity context proxy.
- OpenStreetMap (Overpass API)Cafés, restaurants, retail, transit stops, parking, highways, rail.