Centennial Park - Etobicoke
Waterfront Park, above average overall (score 41, rank ~78th percentile). Strongest: amenity diversity; weakest: enclosure.
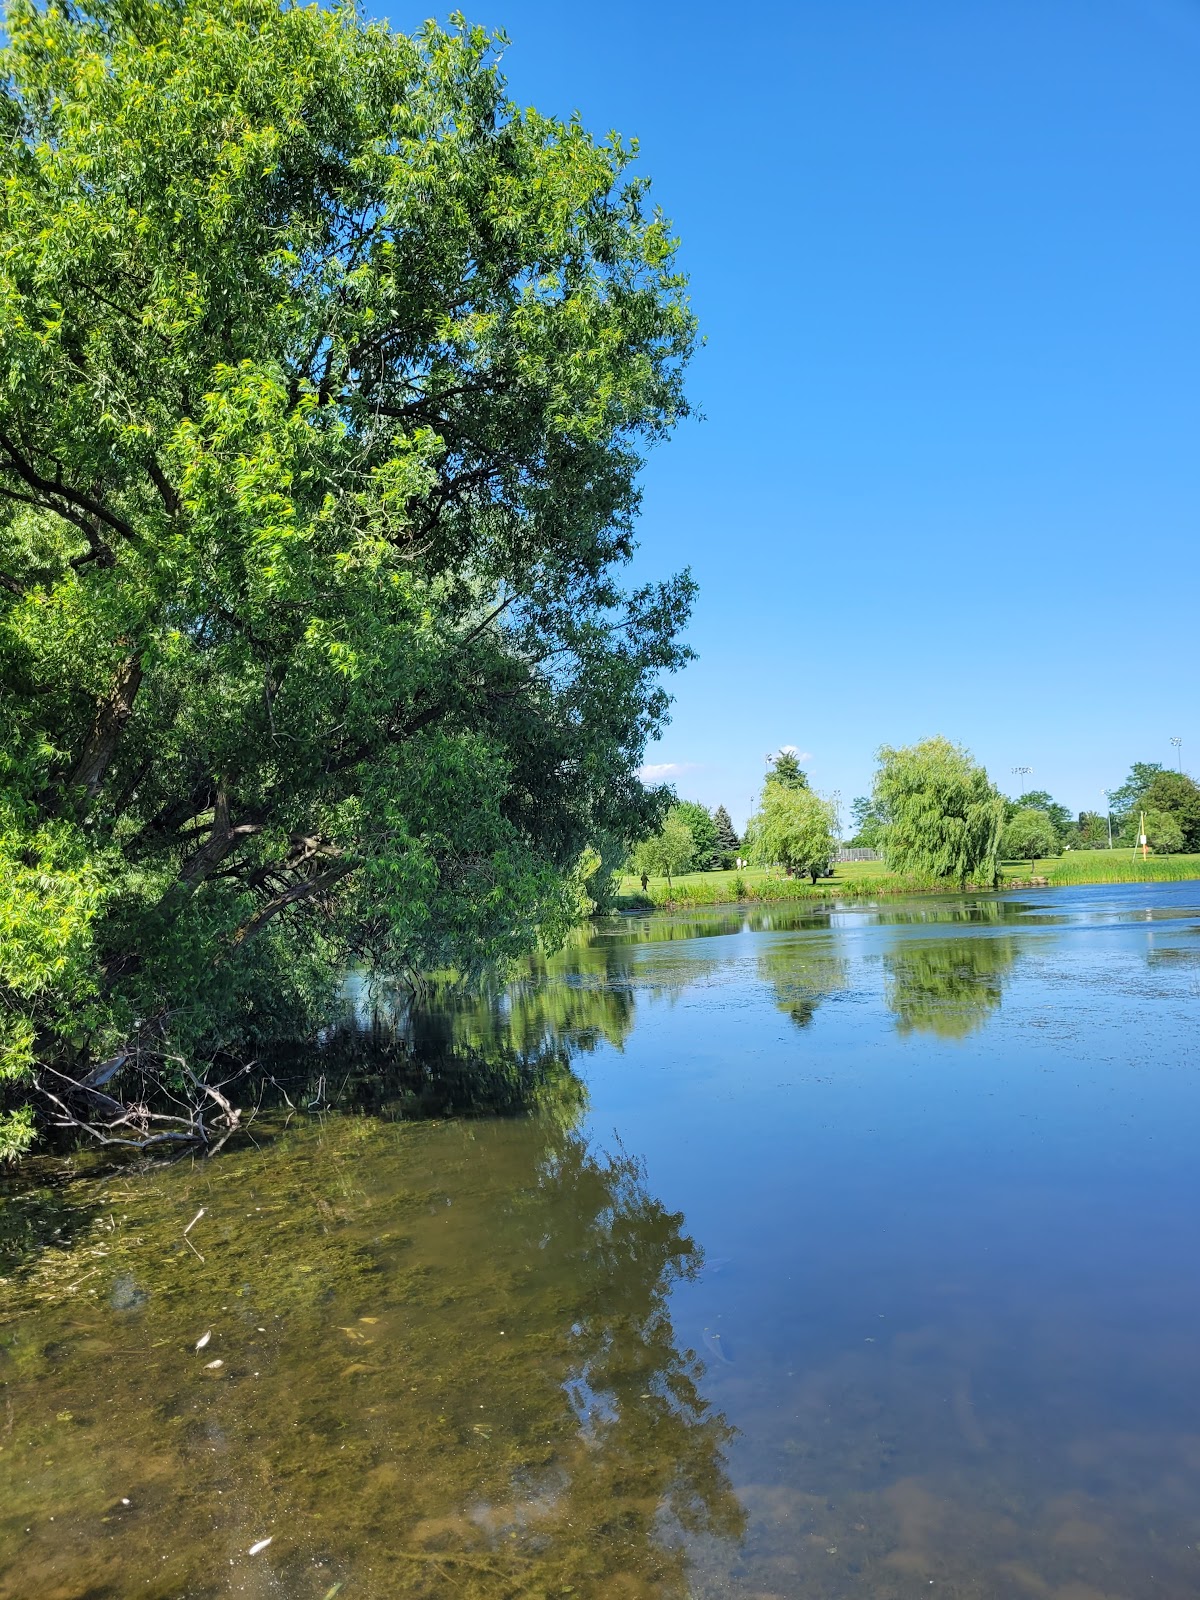
Photo by Nasser El Chayeb via Google Places · cached 5/9/2026
Centennial Park - Etobicoke scores 40.8 / 100. Strongest dimensions: connectivity and natural comfort. Weakest: edge activation (0). Border-vacuum risk is elevated (100). This score is a transparent reading of Jane Jacobs-style vitality factors, not a definitive judgment.
Area · 214.50 ha
Weighted across six dimensions · confidence 72%
Scores are not bell-curved. Percentiles and expected scores provide context without changing the underlying model.
Loading map…
The parks map is loading.
Explain this score
Where did the 41 come from? Each weighted contribution against a neutral 50 baseline. Green = pushed up; red = pulled down.
Sum of contributions = the headline score. A negative bar means that dimension dragged the park below the city-wide neutral baseline.
Why this park works
Centennial Park - Etobicoke works because its amenity diversity score (47) is one of the city's strongest and its connectivity (78) is also top decile (7 distinct amenity types support different kinds of use).
What limits this park
Centennial Park - Etobicoke is held back by enclosure (56, bottom quartile); border-vacuum risk is also elevated (100).
Most distinctive characteristic
Most distinctive feature: exceptionally high amenity diversity (47, top decile).
Jacobs reading
Centennial Park - Etobicoke sits between an urban social park and an ecological retreat: moderately useful for both, exceptionally suited to neither.
Tradeoffs
- High connectivity coexists with high border-vacuum risk (100): much of that connectivity is to highways, rail, or parking lots, not to neighbourhoods.
Performance in context
- A modest overperformer for its waterfront park typology (+6 vs the median in very large Waterfront Park waterfront).
Typology classification
Classified as Waterfront Park: 10% water surface inside park. Secondary read: Ravine / Naturalized Park (42% ravine overlap, 20% canopy).
Edge Activation
Within 100 m of the park edge: 28 active uses (restaurant, transit_stop) and 72 dead/hostile uses (highway, parking_lot). Active edges keep "eyes on the park" through the day; parking lots, blank institutional walls, rail and highway frontages drain street life.
Source: OSM POIs (amenity/shop) + Toronto Building Footprints + land use
Connectivity
Connectivity blends paths, intersections, transit, entrances, and edge density. This park has 70 mapped paths/walkways and 177 sidewalk segments within 50 m; 42 street intersections within 100 m; 77 transit stops within a 400 m walk; 22 estimated access points across ~8,951 m of perimeter. low edge density, significant superblock penalty applied. Source coverage: centreline, pedestrian_network, transit_osm.
Source: Toronto Centreline V2 + Pedestrian Network + OSM transit stops
Amenity Diversity
7 distinct amenity types in the park (community_centre, fitness, picnic, playground, sports_field, track, …). Diversity, not raw count, drives the score so a park with many distinct activity types can outrank a larger park that repeats the same use.
Source: Toronto Parks & Recreation Facilities + OSM amenity tags
Natural Comfort
Natural-comfort components for this park: 20.2% estimated tree canopy; 42.1% inside the ravine system; 9.6% water surface; 680 city-mapped trees inside the polygon (3.2/ha). Reading: ravine-cooled. Source coverage: treed_area, ravine, waterbodies, street_trees. Impervious surface is approximated (Toronto's authoritative layer ships only as a raster GeoTIFF).
Source: Toronto Treed Area + Ravine + Waterbodies + Street Tree Inventory
Enclosure / Eyes on Park
345 buildings within 25 m of the park edge (10 mid-rise, 335 low-rise, 0 tower); avg edge height 5.3 m (~2 floors); 3.9 buildings per 100 m of 8,951 m perimeter (strong frontage density); edges are barely there or single-storey; no towers immediately adjacent. "Eyes on the park" come strongest from the 10 mid-rise edge buildings.
Source: Toronto 3D Massing (building footprints + heights)
Border Vacuum Risk
Border-vacuum factors within 50 m of the park: Eglinton Avenue East, Eglinton Avenue East, Eglinton Avenue West, parking_lot, parking_lot, parking_lot, parking_lot, parking_lot, parking_lot, parking_lot, parking_lot, parking_lot, parking_lot, parking_lot, Eglinton Avenue West, Eglinton Avenue West, Eglinton Avenue West, Eglinton Avenue West, Eglinton Avenue West, Eglinton Avenue West, Eglinton Avenue West, Eglinton Avenue West, Eglinton Avenue West, Eglinton Avenue West, Eglinton Avenue West, Eglinton Avenue West, Eglinton Avenue West, Eglinton Avenue West, Eglinton Avenue West, Eglinton Avenue West, parking_lot, Eglinton Avenue West, Eglinton Avenue West, Eglinton Avenue West, parking_lot, parking_lot, parking_lot, parking_lot, parking_lot, parking_lot, parking_lot, parking_lot, parking_lot, parking_lot, Eglinton Avenue West, parking_lot, parking_lot, parking_lot. Jacobs warned that highways, rail, parking lots and blank institutional edges act as "vacuums" that suppress foot traffic and isolate the park from its neighbourhood.
Source: Toronto Street Centreline (highways) + rail layer + OSM landuse + building footprints
Equity Context
Equity Context requires inputs not yet loaded for this park (Toronto Neighbourhood Profiles). Score is held at a neutral 50 with low confidence. Read with caution.
Source: Toronto Neighbourhood Profiles
Amenities (7 types · 9 records)
- community centre
- fitness
- picnic
- playground
- sports field
- track
- washroom
Nearby active-edge features (80)
- parking lot0 m
- parking lot0 m
- parking lot0 m
- parking lot0 m
- parking lot0 m
- parking lot0 m
- parking lot0 m
- parking lot0 m
- transit stop: 590 Rathburn Road0 m
- parking lot0 m
- parking lot0 m
- parking lot0 m
- parking lot0 m
- parking lot0 m
- parking lot0 m
- parking lot0 m
- parking lot0 m
- parking lot0 m
- transit stop: Elmcrest Road1 m
- transit stop: Ivybridge Drive1 m
- transit stop: Eglinton Avenue At Explorer Drive2 m
- transit stop: Eglinton Avenue At Centennial Park Boulevard5 m
- transit stop: Elmcrest Road8 m
- parking lot8 m
- highway: Eglinton Avenue West9 m
- highway: Eglinton Avenue West12 m
- highway: Eglinton Avenue West13 m
- highway: Eglinton Avenue West13 m
- highway: Eglinton Avenue West14 m
- highway: Eglinton Avenue West14 m
- highway: Eglinton Avenue West14 m
- highway: Eglinton Avenue West15 m
- highway: Eglinton Avenue West15 m
- transit stop: Ivybridge Drive16 m
- parking lot17 m
- highway: Eglinton Avenue West18 m
- restaurant: London Gate British Pub18 m
- highway: Eglinton Avenue West18 m
- highway: Eglinton Avenue West19 m
- highway: Eglinton Avenue West19 m
- highway: Eglinton Avenue West20 m
- highway: Eglinton Avenue West20 m
- highway: Eglinton Avenue West21 m
- parking lot21 m
- transit stop: Melbert Road22 m
- transit stop: Renforth Drive at Eglinton Avenue23 m
- highway: Eglinton Avenue West23 m
- parking lot23 m
- transit stop: Mill Rd at Rathburn Rd Loop24 m
- parking lot24 m
- highway: Eglinton Avenue West25 m
- transit stop26 m
- parking lot30 m
- restaurant: Best Bite Bar & Grill30 m
- transit stop: Eglinton Avenue At Orbitor Drive32 m
- transit stop: Eglinton Avenue At Explorer Drive33 m
- highway: Eglinton Avenue West34 m
- highway: Eglinton Avenue East35 m
- highway: Eglinton Avenue West37 m
- highway: Eglinton Avenue East37 m
- parking lot40 m
- transit stop: Orbitor Station East Platform A42 m
- transit stop: Orbitor43 m
- restaurant: Porta Via Ristorante43 m
- highway: Eglinton Avenue West44 m
- parking lot45 m
- transit stop: Gentian Dr at Renforth Dr50 m
- highway: Eglinton Avenue West51 m
- transit stop: Renforth Drive at Eglinton Avenue54 m
- highway: Eglinton Avenue West54 m
- parking lot56 m
- parking lot59 m
- parking lot61 m
- highway: Eglinton Avenue West62 m
- transit stop: Orbitor Drive at Eglinton Avenue62 m
- transit stop: Eglinton Avenue East Of Satellite Drive62 m
- parking lot63 m
- highway: Eglinton Avenue West64 m
- highway: Eglinton Avenue East69 m
- highway: Eglinton Avenue West70 m
Park profile
Five-axis radar across the structural dimensions.
Citywide percentile ranks
Across all Toronto parks in the dataset.
- Overall vitality78th
- Edge activation27th
- Connectivity97th
- Amenity diversity100th
- Natural comfort82th
- Enclosure21th
Most similar parks
Closest in metric space across the five structural dimensions.
- West Deane ParkRavine / Naturalized Park42
- Marie Curtis ParkWaterfront Park37
- Thomson Memorial ParkCivic Square46
- L'Amoreaux North ParkWaterfront Park44
- Pine Point ParkWaterfront Park36
Most opposite parks
Furthest in metric space. Useful for recognising what kind of park this isn’t.
- Joseph Burr Tyrrell ParkUrban Plaza50
- Bernard Avenue Road AllowanceUrban Plaza54
- Queen'S Quay Traffic IslandWaterfront Park49
- ALEX WILSON COMMUNITY GARDEN - Open Green SpaceUrban Plaza59
- Manor Community GreenUrban Plaza57
Human activity signals: not available
No activity signals have landed for this park yet. The model has scored its physical form but it can’t yet say how often it’s programmed, photographed, or walked through. See /data-ethics for what we will and will not collect.
Does this score feel accurate?
Your read of Centennial Park - Etobicokematters. We’re testing whether the model lines up with how people actually use the park. Submissions are stored locally; no account needed.
Tell us how this park feels
We measure structure (canopy, edges, connectivity). You measure feeling. Both matter, and disagreement is itself useful civic data.
What would improve this park?
Generated from the weakest measured dimensions: a starting point, not a prescription.
- Activate the edges: encourage cafés, retail or community uses on the streets that face the park; replace blank or parking-lot edges where possible.
- Diversify what people can do in the park (playground, washroom, water, shade, performance, sport, garden): even small additions raise this score.
- Mitigate border vacuums (highways, rail, parking) with active programming on the still-permeable edges and treat the hostile edge as a design challenge.
Data sources
- City of Toronto Open Data: Parks (Green Space)Polygon boundaries, official names, types.
- Parks & Recreation FacilitiesInventory of in-park amenities (washrooms, fields, rinks…).
- Toronto Pedestrian NetworkSidewalk segments around and through parks; estimated park entrances.
- Toronto Centreline V2Street segments + intersection nodes near park edges; trails and walkways.
- Toronto 3D MassingBuilding footprints + heights for edge-building counts, frontage density, and tower-in-the-park risk.
- Toronto Treed AreaTree canopy share inside park polygons via stratified-grid sampling.
- Toronto Waterbodies & RiversWater surface inside parks + nearest-water distance for cooling.
- Ravine & Natural Feature ProtectionRavine overlap as a cooling / natural-comfort signal.
- Toronto Street Tree InventoryTree count + density inside park polygons.
- Neighbourhood Profiles(Pending) Equity context proxy.
- OpenStreetMap (Overpass API)Cafés, restaurants, retail, transit stops, parking, highways, rail.