DAVID DUNCAN HOUSE - Building Grounds
Ravine / Naturalized Park, above average overall (score 42, rank ~82th percentile). Strongest: natural comfort; weakest: enclosure.
Photo by David Duncan House via Google Places · cached 5/9/2026
DAVID DUNCAN HOUSE - Building Grounds scores 42 / 100. Strongest dimensions: natural comfort and enclosure / eyes on park. Weakest: amenity diversity (0). Border-vacuum risk is low. This score is a transparent reading of Jane Jacobs-style vitality factors, not a definitive judgment.
Area · 5.35 ha
Weighted across six dimensions · confidence 63%
Scores are not bell-curved. Percentiles and expected scores provide context without changing the underlying model.
Loading map…
The parks map is loading.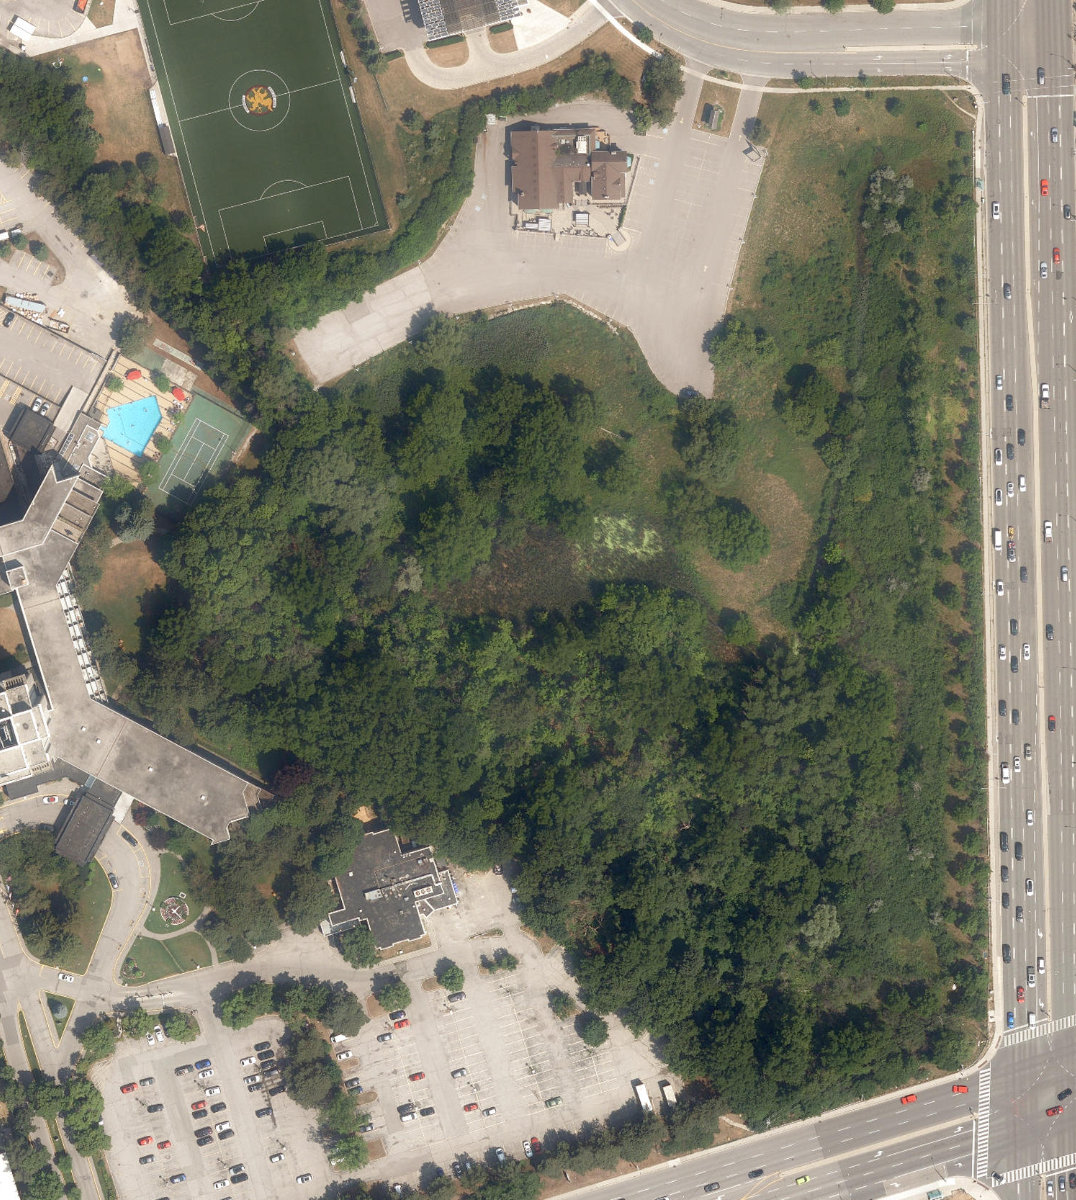
Explain this score
Where did the 42 come from? Each weighted contribution against a neutral 50 baseline. Green = pushed up; red = pulled down.
Sum of contributions = the headline score. A negative bar means that dimension dragged the park below the city-wide neutral baseline.
Why this park works
DAVID DUNCAN HOUSE - Building Grounds works because its natural comfort score (82) is in the top tier and its edge activation (28) is also top quartile (43% tree canopy provides real shade; it sits inside the ravine system).
What limits this park
DAVID DUNCAN HOUSE - Building Grounds is held back by enclosure (52, bottom quartile).
Most distinctive characteristic
Most distinctive feature: exceptionally high natural comfort (82, top decile).
Jacobs reading
DAVID DUNCAN HOUSE - Building Grounds sits between an urban social park and an ecological retreat: moderately useful for both, exceptionally suited to neither.
Tradeoffs
- Natural comfort (82) significantly outpaces connectivity (43): restorative but hard to reach for daily use.
Performance in context
- A modest overperformer for its ravine / naturalized park typology (+6 vs the median in large Ravine / Naturalized Park ravine).
Typology classification
Classified as Ravine / Naturalized Park: 100% ravine overlap, 43% canopy
Edge Activation
Within 100 m of the park edge: 9 active uses (transit_stop, restaurant) and 4 dead/hostile uses (parking_lot). Active edges keep "eyes on the park" through the day; parking lots, blank institutional walls, rail and highway frontages drain street life.
Source: OSM POIs (amenity/shop) + Toronto Building Footprints + land use
Connectivity
Connectivity blends paths, intersections, transit, entrances, and edge density. This park has 0 mapped paths/walkways and 17 sidewalk segments within 50 m; 2 street intersections within 100 m; 22 transit stops within a 400 m walk; 0 estimated access points across ~942 m of perimeter. low edge density, significant superblock penalty applied. Source coverage: centreline, pedestrian_network, transit_osm.
Source: Toronto Centreline V2 + Pedestrian Network + OSM transit stops
Amenity Diversity
No amenities recorded. Score is 0 until inventory is loaded.
Source: Toronto Parks & Recreation Facilities + OSM amenity tags
Natural Comfort
Natural-comfort components for this park: 42.6% estimated tree canopy; 100.0% inside the ravine system; nearest waterbody ~277 m; 10 city-mapped trees inside the polygon (1.9/ha). Reading: ravine-cooled. Source coverage: treed_area, ravine, waterbodies, street_trees. Impervious surface is approximated (Toronto's authoritative layer ships only as a raster GeoTIFF).
Source: Toronto Treed Area + Ravine + Waterbodies + Street Tree Inventory
Enclosure / Eyes on Park
10 buildings within 25 m of the park edge (4 mid-rise, 5 low-rise, 1 tower); avg edge height 18.1 m (~6 floors); 1.1 buildings per 100 m of 942 m perimeter (thin frontage with significant blank-edge share); edges are at a Jacobs-scale walkable mid-rise (3 to 7 floors); 1 tower ≥ 40 m within 25 m of the edge. "Eyes on the park" come strongest from the 4 mid-rise edge buildings.
Source: Toronto 3D Massing (building footprints + heights)
Border Vacuum Risk
Border-vacuum factors within 50 m of the park: parking_lot. Jacobs warned that highways, rail, parking lots and blank institutional edges act as "vacuums" that suppress foot traffic and isolate the park from its neighbourhood.
Source: Toronto Street Centreline (highways) + rail layer + OSM landuse + building footprints
Equity Context
Equity Context requires inputs not yet loaded for this park (Toronto Neighbourhood Profiles). Score is held at a neutral 50 with low confidence. Read with caution.
Source: Toronto Neighbourhood Profiles
Amenities (0)
No amenities recorded for this park.
Nearby active-edge features (41)
- transit stop: Moatfield Drive0 m
- parking lot0 m
- transit stop: York Mills Road13 m
- restaurant: Gilaneh21 m
- transit stop: Moatfield Drive41 m
- transit stop: Don Mills Road52 m
- transit stop: Don Mills Road55 m
- parking lot57 m
- parking lot63 m
- transit stop: York Mills Road67 m
- parking lot75 m
- restaurant: Darband76 m
- restaurant: Pizza Nova97 m
- restaurant: Subway103 m
- restaurant: Casa Manila104 m
- parking lot106 m
- parking lot107 m
- parking lot112 m
- transit stop: 900 York Mills Road128 m
- parking lot131 m
- parking lot138 m
- restaurant: Popeyes139 m
- parking lot139 m
- restaurant: Captain's Boil148 m
- parking lot154 m
- parking lot159 m
- restaurant: Robo Sushi161 m
- restaurant: Cucina Di Paisano167 m
- parking lot169 m
- parking lot170 m
- parking lot170 m
- parking lot174 m
- retail: The Colour Field174 m
- retail: Saltwater Pros175 m
- restaurant: Taftan Kebob178 m
- transit stop182 m
- restaurant: Firehouse Subs185 m
- retail: Custom Care Cleaners192 m
- transit stop195 m
- parking lot196 m
- restaurant: Fox & Fiddle198 m
Park profile
Five-axis radar across the structural dimensions.
Citywide percentile ranks
Across all Toronto parks in the dataset.
- Overall vitality82th
- Edge activation86th
- Connectivity41th
- Amenity diversity38th
- Natural comfort93th
- Enclosure17th
Most similar parks
Closest in metric space across the five structural dimensions.
- Rouge ParkRavine / Naturalized Park44
- Garland ParkParkette42
- Adam'S Creek RavineRavine / Naturalized Park42
- Massey Creek WatercourseWaterfront Park45
- City Wide Open SpaceRavine / Naturalized Park43
Most opposite parks
Furthest in metric space. Useful for recognising what kind of park this isn’t.
- ALEX WILSON COMMUNITY GARDEN - Open Green SpaceUrban Plaza59
- Leslie Grove ParkParkette68
- Withrow ParkNeighbourhood Park50
- Ramsden ParkRavine / Naturalized Park43
- Sonya'S ParkUrban Plaza60
Visitor signals
Public attention measured by Google Places aggregates. This proxies attention, not occupancy. Aggregate-only: no usernames, no review text, no extra photos beyond the cached hero.
“Elegant fine-dining mainstay known for its art deco decor, prime steaks & seafood entrees.” (Google editorial summary)
p53 citywide · p60 within Ravine / Naturalized Park
- match flagged for human review, confidence dampened
Source: Google Places API · match needs_review (0.67 composite confidence) · last refreshed 5/9/2026. Privacy contract. Measures public attention, not occupancy.
Human activity signals: not available
No activity signals have landed for this park yet. The model has scored its physical form but it can’t yet say how often it’s programmed, photographed, or walked through. See /data-ethics for what we will and will not collect.
Does this score feel accurate?
Your read of DAVID DUNCAN HOUSE - Building Groundsmatters. We’re testing whether the model lines up with how people actually use the park. Submissions are stored locally; no account needed.
Tell us how this park feels
We measure structure (canopy, edges, connectivity). You measure feeling. Both matter, and disagreement is itself useful civic data.
What would improve this park?
Generated from the weakest measured dimensions: a starting point, not a prescription.
- Activate the edges: encourage cafés, retail or community uses on the streets that face the park; replace blank or parking-lot edges where possible.
- Add or open more entrances and improve sidewalk continuity around the park. More permeability means more spontaneous use.
- Diversify what people can do in the park (playground, washroom, water, shade, performance, sport, garden): even small additions raise this score.
Data sources
- City of Toronto Open Data: Parks (Green Space)Polygon boundaries, official names, types.
- Parks & Recreation FacilitiesInventory of in-park amenities (washrooms, fields, rinks…).
- Toronto Pedestrian NetworkSidewalk segments around and through parks; estimated park entrances.
- Toronto Centreline V2Street segments + intersection nodes near park edges; trails and walkways.
- Toronto 3D MassingBuilding footprints + heights for edge-building counts, frontage density, and tower-in-the-park risk.
- Toronto Treed AreaTree canopy share inside park polygons via stratified-grid sampling.
- Toronto Waterbodies & RiversWater surface inside parks + nearest-water distance for cooling.
- Ravine & Natural Feature ProtectionRavine overlap as a cooling / natural-comfort signal.
- Toronto Street Tree InventoryTree count + density inside park polygons.
- Neighbourhood Profiles(Pending) Equity context proxy.
- OpenStreetMap (Overpass API)Cafés, restaurants, retail, transit stops, parking, highways, rail.