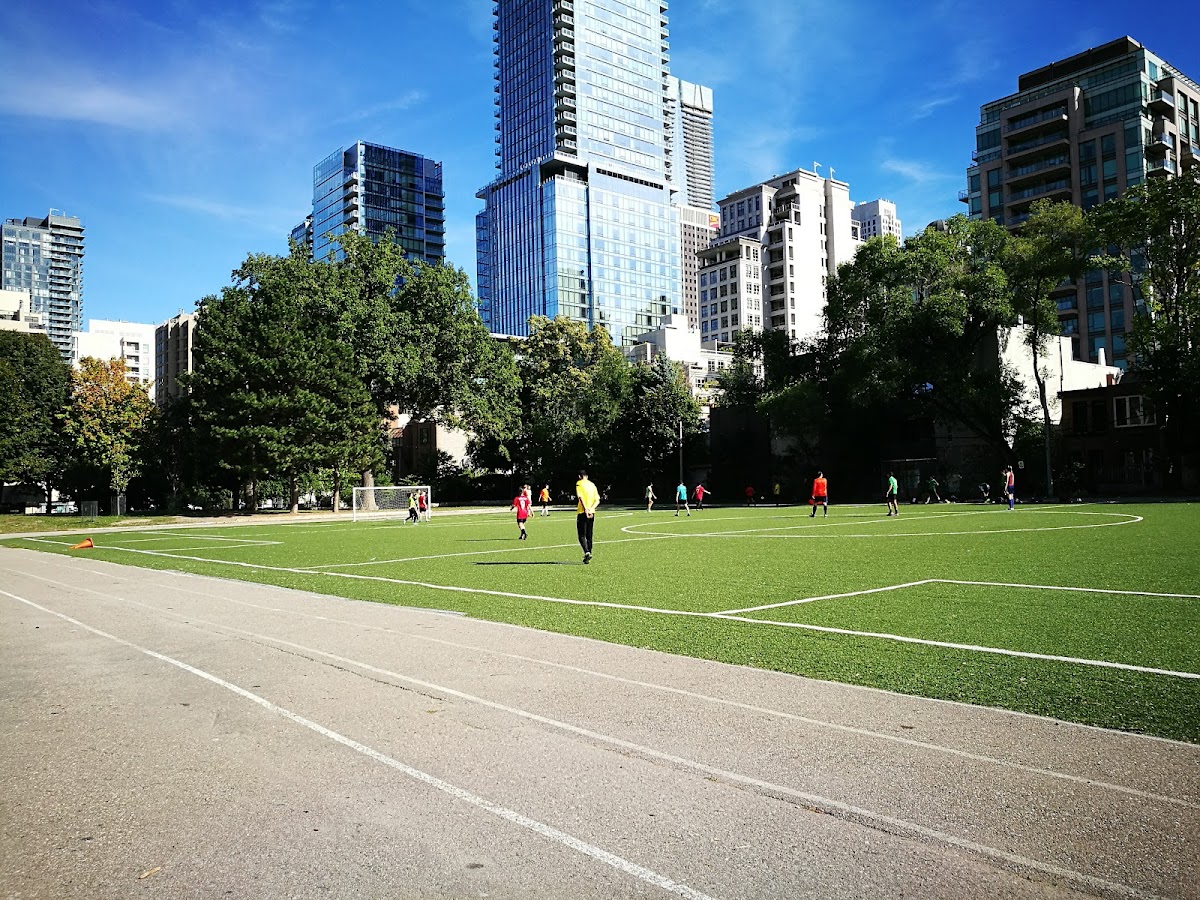
Jesse Ketchum Park
Urban Plaza, one of the city's strongest overall (score 51, rank ~96th percentile). Strongest: edge activation; weakest: natural comfort.
Photo by Julia Roitsch via Google Places · cached 5/9/2026
Jesse Ketchum Park scores 51 / 100. Strongest dimensions: enclosure / eyes on park and connectivity. Weakest: amenity diversity (0). Border-vacuum risk is low. This score is a transparent reading of Jane Jacobs-style vitality factors, not a definitive judgment.
Area · 0.16 ha
Weighted across six dimensions · confidence 57%
Scores are not bell-curved. Percentiles and expected scores provide context without changing the underlying model.
Loading map…
The parks map is loading.
Explain this score
Where did the 51 come from? Each weighted contribution against a neutral 50 baseline. Green = pushed up; red = pulled down.
Sum of contributions = the headline score. A negative bar means that dimension dragged the park below the city-wide neutral baseline.
Why this park works
Jesse Ketchum Park works because its edge activation score (54) is one of the city's strongest and its enclosure (89) is also top decile (its perimeter is lined with active uses).
What limits this park
Jesse Ketchum Park is held back by natural comfort (32, bottom quartile): only 0% canopy means little summer shade.
Most distinctive characteristic
Most distinctive feature: exceptionally high edge activation (54, top decile).
Jacobs reading
Jesse Ketchum Park sits between an urban social park and an ecological retreat: moderately useful for both, exceptionally suited to neither.
Tradeoffs
- Connectivity (70) significantly outpaces natural comfort (32): well placed in the city but offers little shade or ecological respite.
- 27 nearby towers cast wind and shadow without contributing canopy: passive surveillance is plentiful but human-scale comfort is not.
Performance in context
- This park is a strong overperformer for its cohort: raw 51 versus an expected 36 for similar parks (pocket Urban Plaza) (gap +15).
Typology classification
Classified as Urban Plaza: 1645 m², paved (0% canopy), 71.9 buildings/100 m
Edge Activation
Within 100 m of the park edge: 7 active uses (retail, transit_stop, restaurant) and 0 dead/hostile uses (none). Active edges keep "eyes on the park" through the day; parking lots, blank institutional walls, rail and highway frontages drain street life.
Source: OSM POIs (amenity/shop) + Toronto Building Footprints + land use
Connectivity
Connectivity blends paths, intersections, transit, entrances, and edge density. This park has 8 mapped paths/walkways and 15 sidewalk segments within 50 m; 8 street intersections within 100 m; 30 transit stops within a 400 m walk; 2 estimated access points across ~178 m of perimeter. edge density is healthy, no superblock penalty. Source coverage: centreline, pedestrian_network, transit_osm.
Source: Toronto Centreline V2 + Pedestrian Network + OSM transit stops
Amenity Diversity
No amenities recorded. Score is 0 until inventory is loaded.
Source: Toronto Parks & Recreation Facilities + OSM amenity tags
Natural Comfort
Natural-comfort components for this park: 0.0% estimated tree canopy; nearest waterbody ~1244 m; 1 city-mapped trees inside the polygon (1.0/ha). Reading: exposed. Source coverage: waterbodies, street_trees. Impervious surface is approximated (Toronto's authoritative layer ships only as a raster GeoTIFF).
Source: Toronto Treed Area + Ravine + Waterbodies + Street Tree Inventory
Enclosure / Eyes on Park
128 buildings within 25 m of the park edge (65 mid-rise, 36 low-rise, 27 tower); avg edge height 23.7 m (~8 floors); 71.9 buildings per 100 m of 178 m perimeter (strong frontage density); edges lean tall but still framed; 27 towers ≥ 40 m within 25 m of the edge. "Eyes on the park" come strongest from the 65 mid-rise edge buildings.
Source: Toronto 3D Massing (building footprints + heights)
Border Vacuum Risk
Park edges face the city. No significant border vacuum detected.
Source: Toronto Street Centreline (highways) + rail layer + OSM landuse + building footprints
Equity Context
Equity Context requires inputs not yet loaded for this park (Toronto Neighbourhood Profiles). Score is held at a neutral 50 with low confidence. Read with caution.
Source: Toronto Neighbourhood Profiles
Amenities (0)
No amenities recorded for this park.
Nearby active-edge features (51)
- retail: Beloved Tan7 m
- transit stop: Davenport Road21 m
- transit stop: Bay Street29 m
- retail: Piquadro51 m
- retail: LF Optical82 m
- restaurant: revitasize84 m
- retail: Hazelway Luxury Silk Bedding & Furniture96 m
- restaurant: 70 Down Yorkville104 m
- restaurant: d|bar109 m
- parking lot109 m
- restaurant: Flo's114 m
- parking lot119 m
- retail: Anthropologie121 m
- retail: Sunglass Hut126 m
- retail: BUCA129 m
- restaurant: Utsav Indian Cuisine129 m
- retail: The Noble Society132 m
- retail: Royal Dry Cleaners133 m
- restaurant: Dynasty Chinese Cuisine134 m
- retail: For Lease135 m
- retail: Otto138 m
- retail: Lolë138 m
- restaurant: Trattoria Nervosa139 m
- restaurant: Dynasty Chinese Cuisine (Last Straw Distillery)140 m
- retail: Hon Tattoo Studio - Downtown Toronto141 m
- restaurant: Chabrol142 m
- cafe: Zaza Espresso Bar149 m
- retail: La Boutique Noire149 m
- parking lot152 m
- retail: Pink Tartan155 m
- retail: Diesel159 m
- restaurant: Salutè Piano & Wine Bar161 m
- parking lot162 m
- retail: Candle Emporium162 m
- parking lot168 m
- retail: Pet Valu172 m
- restaurant: Vaticano Ristorante172 m
- retail: Kumari's175 m
- restaurant: Miznon176 m
- restaurant: Caffe Di Portici176 m
- retail: Rolo Store177 m
- retail: Taz Hair Co178 m
- retail: Laywine's180 m
- cafe: Summer's185 m
- retail: The Cashmere Shop186 m
- restaurant: Yamato188 m
- retail: Ritchie's Estate Jewellery191 m
- retail: Perry's193 m
- retail: Wine Rack197 m
- retail: Stollery's197 m
- parking lot197 m
Park profile
Five-axis radar across the structural dimensions.
Citywide percentile ranks
Across all Toronto parks in the dataset.
- Overall vitality96th
- Edge activation97th
- Connectivity90th
- Amenity diversity63th
- Natural comfort15th
- Enclosure95th
Most similar parks
Closest in metric space across the five structural dimensions.
- Cathedral Church Of St. JamesParkette47
- Roxborough - Yonge St Traffic IslandUrban Plaza43
- Shaw St Traffic Median NorthCorridor / Linear Park48
- Earlscourt ParkUrban Plaza51
- Village Of Yorkville ParkUrban Plaza44
Most opposite parks
Furthest in metric space. Useful for recognising what kind of park this isn’t.
- Trca Lands ( 26)Ravine / Naturalized Park27
- Toronto Islands - Muggs Island ParkRavine / Naturalized Park25
- Rouge ParkRavine / Naturalized Park28
- Rouge ParkWaterfront Park25
- Rouge ParkRavine / Naturalized Park26
Visitor signals
Public attention measured by Google Places aggregates. This proxies attention, not occupancy. Aggregate-only: no usernames, no review text, no extra photos beyond the cached hero.
p83 citywide · p95 within Urban Plaza
Source: Google Places API · match high (1.00 composite confidence) · last refreshed 5/9/2026. Privacy contract. Measures public attention, not occupancy.
Human activity signals: not available
No activity signals have landed for this park yet. The model has scored its physical form but it can’t yet say how often it’s programmed, photographed, or walked through. See /data-ethics for what we will and will not collect.
Does this score feel accurate?
Your read of Jesse Ketchum Parkmatters. We’re testing whether the model lines up with how people actually use the park. Submissions are stored locally; no account needed.
Tell us how this park feels
We measure structure (canopy, edges, connectivity). You measure feeling. Both matter, and disagreement is itself useful civic data.
What would improve this park?
Generated from the weakest measured dimensions: a starting point, not a prescription.
- Diversify what people can do in the park (playground, washroom, water, shade, performance, sport, garden): even small additions raise this score.
- Increase canopy and reduce paved area. Shade and water features extend usable hours and seasons.
Data sources
- City of Toronto Open Data: Parks (Green Space)Polygon boundaries, official names, types.
- Parks & Recreation FacilitiesInventory of in-park amenities (washrooms, fields, rinks…).
- Toronto Pedestrian NetworkSidewalk segments around and through parks; estimated park entrances.
- Toronto Centreline V2Street segments + intersection nodes near park edges; trails and walkways.
- Toronto 3D MassingBuilding footprints + heights for edge-building counts, frontage density, and tower-in-the-park risk.
- Toronto Treed AreaTree canopy share inside park polygons via stratified-grid sampling.
- Toronto Waterbodies & RiversWater surface inside parks + nearest-water distance for cooling.
- Ravine & Natural Feature ProtectionRavine overlap as a cooling / natural-comfort signal.
- Toronto Street Tree InventoryTree count + density inside park polygons.
- Neighbourhood Profiles(Pending) Equity context proxy.
- OpenStreetMap (Overpass API)Cafés, restaurants, retail, transit stops, parking, highways, rail.