Stanley Park
Athletic / Recreation Park, in the top tier overall (score 44, rank ~87th percentile). Strongest: amenity diversity; weakest: enclosure.
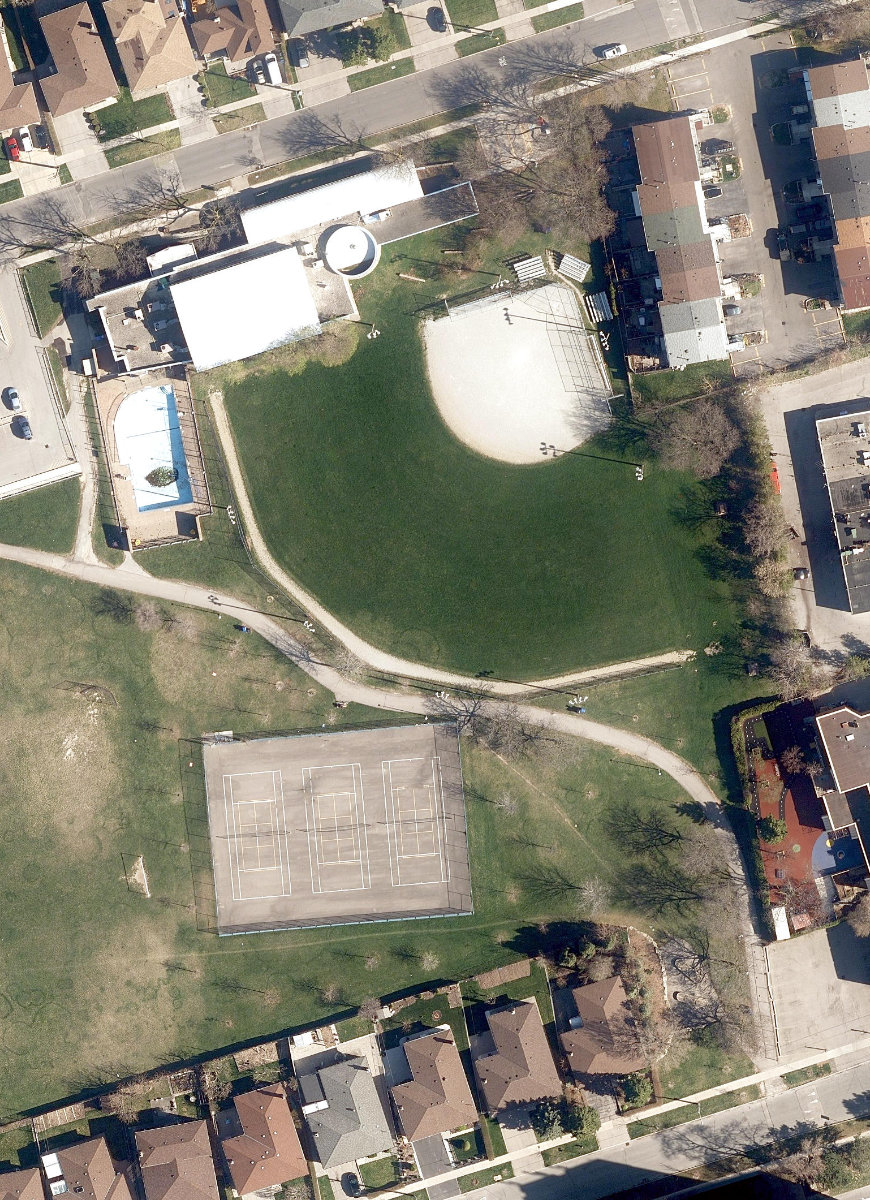
Aerial, City of Toronto orthophoto, ~8 cm/px source · cached 5/9/2026
Stanley Park scores 43.7 / 100. Strongest dimensions: enclosure / eyes on park and connectivity. Weakest: edge activation (22.5). Border-vacuum risk is low. This score is a transparent reading of Jane Jacobs-style vitality factors, not a definitive judgment.
Area · 1.79 ha
Weighted across six dimensions · confidence 68%
Scores are not bell-curved. Percentiles and expected scores provide context without changing the underlying model.
Loading map…
The parks map is loading.Explain this score
Where did the 44 come from? Each weighted contribution against a neutral 50 baseline. Green = pushed up; red = pulled down.
Sum of contributions = the headline score. A negative bar means that dimension dragged the park below the city-wide neutral baseline.
Why this park works
Stanley Park works because its amenity diversity score (28) is in the top tier and its edge activation (23) is also top quartile.
What limits this park
.
Most distinctive characteristic
Most distinctive feature: exceptionally high amenity diversity (28, top decile).
Jacobs reading
Stanley Park sits between an urban social park and an ecological retreat: moderately useful for both, exceptionally suited to neither.
Tradeoffs
- The park is enclosed by buildings (60) but the surrounding streets are quiet (edge activation 23): frame without animation.
Performance in context
- Citywide rank is high (87th) but typology rank is more modest (59th): the strength likely comes from the dataset average pulling lower than this typology’s baseline.
Typology classification
Classified as Athletic / Recreation Park: 67% of amenity types are athletic (sports_field, tennis). Secondary read: Neighbourhood Park (1.8 ha, framed by 1 mid-rise vs 0 towers).
Edge Activation
Within 100 m of the park edge: 10 active uses (retail, restaurant, transit_stop) and 5 dead/hostile uses (parking_lot). Active edges keep "eyes on the park" through the day; parking lots, blank institutional walls, rail and highway frontages drain street life.
Source: OSM POIs (amenity/shop) + Toronto Building Footprints + land use
Connectivity
Connectivity blends paths, intersections, transit, entrances, and edge density. This park has 5 mapped paths/walkways and 8 sidewalk segments within 50 m; 9 street intersections within 100 m; 12 transit stops within a 400 m walk; 4 estimated access points across ~619 m of perimeter. low edge density, significant superblock penalty applied. Source coverage: centreline, pedestrian_network, transit_osm.
Source: Toronto Centreline V2 + Pedestrian Network + OSM transit stops
Amenity Diversity
3 distinct amenity types in the park (community_centre, sports_field, tennis). Diversity, not raw count, drives the score so a park with many distinct activity types can outrank a larger park that repeats the same use.
Source: Toronto Parks & Recreation Facilities + OSM amenity tags
Natural Comfort
Natural-comfort components for this park: ~16.5% effective canopy (0.0% from contiguous tree polygons + scattered tree density); nearest waterbody ~763 m; 42 city-mapped trees inside the polygon (23.5/ha). Reading: exposed. Source coverage: waterbodies, street_trees. Impervious surface is approximated (Toronto's authoritative layer ships only as a raster GeoTIFF).
Source: Toronto Treed Area + Ravine + Waterbodies + Street Tree Inventory
Enclosure / Eyes on Park
47 buildings within 25 m of the park edge (1 mid-rise, 46 low-rise, 0 tower); avg edge height 5.1 m (~2 floors); 7.6 buildings per 100 m of 619 m perimeter (strong frontage density); edges are barely there or single-storey; no towers immediately adjacent. "Eyes on the park" come strongest from the 1 mid-rise edge buildings.
Source: Toronto 3D Massing (building footprints + heights)
Border Vacuum Risk
Border-vacuum factors within 50 m of the park: parking_lot, parking_lot. Jacobs warned that highways, rail, parking lots and blank institutional edges act as "vacuums" that suppress foot traffic and isolate the park from its neighbourhood.
Source: Toronto Street Centreline (highways) + rail layer + OSM landuse + building footprints
Equity Context
Equity Context requires inputs not yet loaded for this park (Toronto Neighbourhood Profiles). Score is held at a neutral 50 with low confidence. Read with caution.
Source: Toronto Neighbourhood Profiles
Amenities (3 types · 3 records)
- community centre
- sports field
- tennis
Nearby active-edge features (45)
- parking lot13 m
- retail: Custitos De Mi Tierra25 m
- restaurant: SaiGon Shop26 m
- restaurant: Backstage Bar & Restaurant26 m
- restaurant: Banh Cuon Huong Que27 m
- parking lot48 m
- parking lot56 m
- parking lot57 m
- transit stop: Jane St at Clair Rd64 m
- parking lot72 m
- retail: Destiny’s Hairport76 m
- transit stop: Jane St at Stanley Rd79 m
- retail: M&D Convenience82 m
- retail: Sisi Meats86 m
- transit stop: Jane St at Spenvalley Dr91 m
- parking lot108 m
- transit stop: Jane St at Rita Dr110 m
- parking lot117 m
- restaurant: Pizza Pizza118 m
- retail: Axess Gift & Convenience120 m
- restaurant: Da Nang Restaurant124 m
- retail: La Stella Bakery127 m
- parking lot129 m
- retail: Money Mart130 m
- retail: Joseph & Rocky Barber Shop132 m
- parking lot135 m
- retail: Sentinel Coin Laundry136 m
- parking lot138 m
- restaurant: Wing Machine151 m
- retail: Upstyle Passion Salon155 m
- restaurant: Pho Cuu Long Mien Tay159 m
- parking lot163 m
- retail: Cash Stop166 m
- parking lot166 m
- parking lot170 m
- retail: True Color Nails & Spa171 m
- parking lot173 m
- retail: DT Jewellery173 m
- retail: Kitchen Food Fair177 m
- retail: Jane Variety185 m
- parking lot190 m
- retail: Your Family Cleaners190 m
- retail: Freedom Mobile193 m
- transit stop: Sheppard Avenue West196 m
- retail: Albair Hair Plus197 m
Park profile
Five-axis radar across the structural dimensions.
Citywide percentile ranks
Across all Toronto parks in the dataset.
- Overall vitality87th
- Edge activation79th
- Connectivity69th
- Amenity diversity95th
- Natural comfort58th
- Enclosure36th
Most similar parks
Closest in metric space across the five structural dimensions.
- Indian Line ParkRavine / Naturalized Park49
- Sweeney ParkAthletic / Recreation Park47
- Mossgrove ParkCorridor / Linear Park41
- Esther Lorrie ParkRavine / Naturalized Park43
- Halbert ParkNeighbourhood Park47
Most opposite parks
Furthest in metric space. Useful for recognising what kind of park this isn’t.
- Trca Lands ( 26)Ravine / Naturalized Park27
- Toronto Islands - Muggs Island ParkRavine / Naturalized Park25
- Rouge ParkRavine / Naturalized Park28
- Rouge ParkRavine / Naturalized Park26
- Rouge ParkWaterfront Park25
Human activity signals: not available
No activity signals have landed for this park yet. The model has scored its physical form but it can’t yet say how often it’s programmed, photographed, or walked through. See /data-ethics for what we will and will not collect.
Does this score feel accurate?
Your read of Stanley Parkmatters. We’re testing whether the model lines up with how people actually use the park. Submissions are stored locally; no account needed.
Tell us how this park feels
We measure structure (canopy, edges, connectivity). You measure feeling. Both matter, and disagreement is itself useful civic data.
What would improve this park?
Generated from the weakest measured dimensions: a starting point, not a prescription.
- Activate the edges: encourage cafés, retail or community uses on the streets that face the park; replace blank or parking-lot edges where possible.
- Diversify what people can do in the park (playground, washroom, water, shade, performance, sport, garden): even small additions raise this score.
- Increase canopy and reduce paved area. Shade and water features extend usable hours and seasons.
Data sources
- City of Toronto Open Data: Parks (Green Space)Polygon boundaries, official names, types.
- Parks & Recreation FacilitiesInventory of in-park amenities (washrooms, fields, rinks…).
- Toronto Pedestrian NetworkSidewalk segments around and through parks; estimated park entrances.
- Toronto Centreline V2Street segments + intersection nodes near park edges; trails and walkways.
- Toronto 3D MassingBuilding footprints + heights for edge-building counts, frontage density, and tower-in-the-park risk.
- Toronto Treed AreaTree canopy share inside park polygons via stratified-grid sampling.
- Toronto Waterbodies & RiversWater surface inside parks + nearest-water distance for cooling.
- Ravine & Natural Feature ProtectionRavine overlap as a cooling / natural-comfort signal.
- Toronto Street Tree InventoryTree count + density inside park polygons.
- Neighbourhood Profiles(Pending) Equity context proxy.
- OpenStreetMap (Overpass API)Cafés, restaurants, retail, transit stops, parking, highways, rail.