Milner Parkette
Urban Plaza, in the top tier overall (score 46, rank ~90th percentile). Strongest: enclosure; weakest: natural comfort.
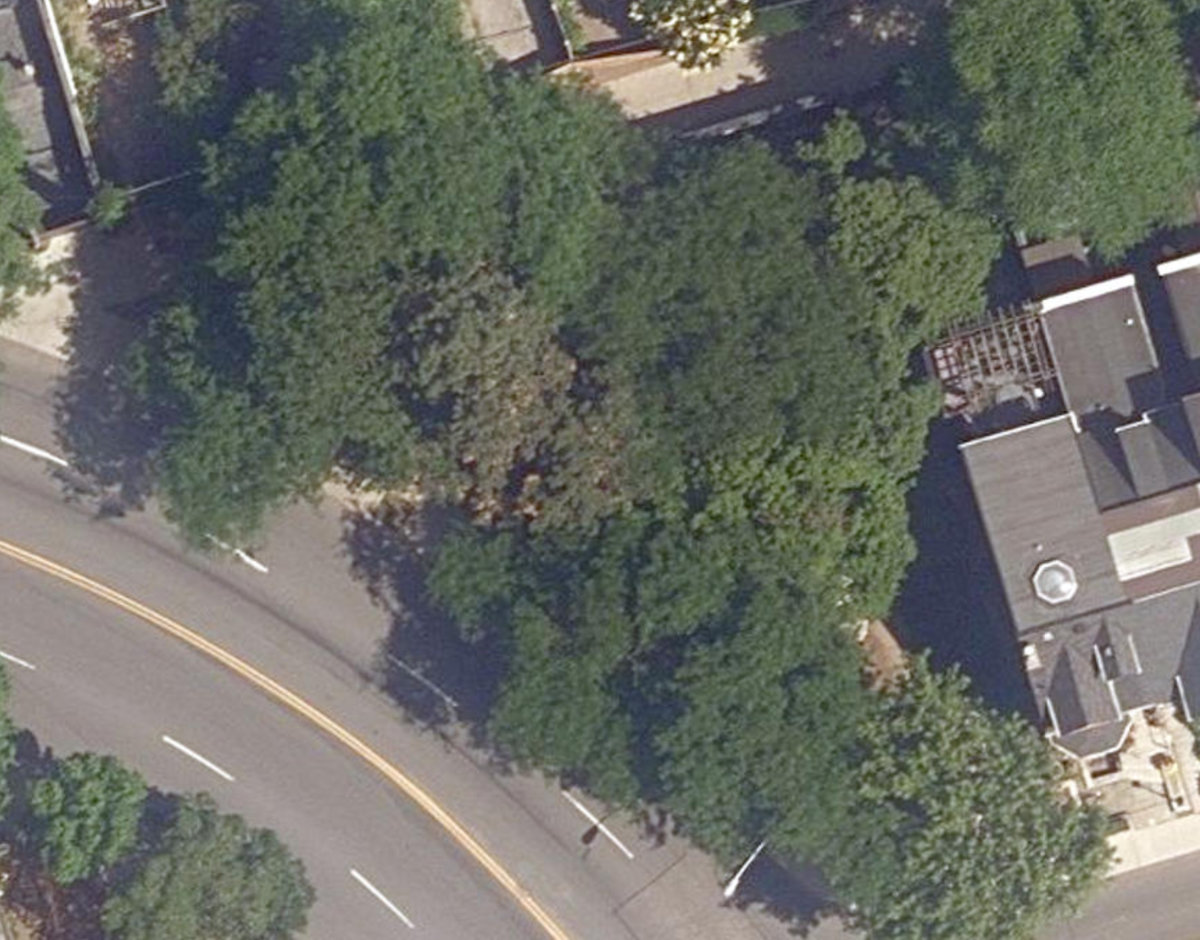
Aerial — City of Toronto orthophoto, ~8 cm/px source · cached 5/9/2026
Milner Parkette scores 46 / 100. Strongest dimensions: enclosure / eyes on park and connectivity. Weakest: amenity diversity (0). Border-vacuum risk is low. This score is a transparent reading of Jane Jacobs-style vitality factors — not a definitive judgment.
Area · 0.06 ha
Weighted across six dimensions · confidence 56%
Scores are not bell-curved. Percentiles and expected scores provide context without changing the underlying model.
Explain this score
Where did the 46 come from? Each weighted contribution against a neutral 50 baseline. Green = pushed up; red = pulled down.
Sum of contributions = the headline score. A negative bar means that dimension dragged the park below the city-wide neutral baseline.
Why this park works
What limits this park
Most distinctive characteristic
Jacobs reading
Tradeoffs
- Connectivity (75) significantly outpaces natural comfort (24) — well placed in the city but offers little shade or ecological respite.
- 8 nearby towers cast wind and shadow without contributing canopy — passive surveillance is plentiful but human-scale comfort is not.
- Strong physical conditions (score 46) but weak observed activity signals (9) — the model says this should work, but events, mentions, and counters say it isn't being used at the level the urban form would predict.
- High connectivity (75) coexists with little programming evidence — easy to reach, but no recurring civic life detected.
Performance in context
- A modest overperformer for its urban plaza typology (+10 vs the median in pocket Urban Plaza).
Typology classification
Classified as Urban Plaza: 569 m², paved (0% canopy), 42.8 buildings/100 m
Edge Activation
Within 100 m of the park edge: 3 active uses (retail, restaurant) and 0 dead/hostile uses (none). Active edges keep "eyes on the park" through the day; parking lots, blank institutional walls, rail and highway frontages drain street life.
Source: OSM POIs (amenity/shop) + Toronto Building Footprints + land use
Connectivity
Connectivity blends paths, intersections, transit, entrances, and edge density. This park has 6 mapped paths/walkways and 20 sidewalk segments within 50 m; 14 street intersections within 100 m; 20 transit stops within a 400 m walk; 3 estimated access points across ~107 m of perimeter. edge density is healthy — no superblock penalty. Source coverage: centreline, pedestrian_network, transit_osm.
Source: Toronto Centreline V2 + Pedestrian Network + OSM transit stops
Amenity Diversity
No amenities recorded — score is 0 until inventory is loaded.
Source: Toronto Parks & Recreation Facilities + OSM amenity tags
Natural Comfort
Natural-comfort components for this park: 0.0% estimated tree canopy; nearest waterbody ~913 m. Reading: exposed. Source coverage: waterbodies. Impervious surface is approximated (Toronto's authoritative layer ships only as a raster GeoTIFF).
Source: Toronto Treed Area + Ravine + Waterbodies + Street Tree Inventory
Enclosure / Eyes on Park
46 buildings within 25 m of the park edge (24 mid-rise, 14 low-rise, 8 tower); avg edge height 21.1 m (~7 floors); 42.8 buildings per 100 m of 107 m perimeter — strong frontage density; edges lean tall but still framed; 8 towers ≥ 40 m within 25 m of the edge. "Eyes on the park" come strongest from the 24 mid-rise edge buildings.
Source: Toronto 3D Massing (building footprints + heights)
Border Vacuum Risk
Park edges face the city — no significant border vacuum detected.
Source: Toronto Street Centreline (highways) + rail layer + OSM landuse + building footprints
Equity Context
Equity Context requires inputs not yet loaded for this park (Toronto Neighbourhood Profiles). Score is held at a neutral 50 with low confidence — read with caution.
Source: Toronto Neighbourhood Profiles
Amenities (0)
No amenities recorded for this park.
Nearby active-edge features (51)
- restaurant — La Prep58 m
- retail — The Printing House74 m
- retail — Rabba85 m
- restaurant — PI CO.106 m
- parking lot117 m
- restaurant — Pizza Hut Express118 m
- restaurant — Yuzuki121 m
- restaurant — Villa Madina122 m
- restaurant — Mad Radish123 m
- highway — Bloor Street East123 m
- restaurant — Thaï Express124 m
- restaurant — Sunset Grill125 m
- highway — Bloor Street East126 m
- highway — Bloor Street East127 m
- highway — Bloor Street East131 m
- restaurant — A&W131 m
- restaurant — Subway134 m
- highway — Bloor Street East134 m
- restaurant — Manchu Wok137 m
- highway — Bloor Street East141 m
- cafe — Tim Hortons142 m
- highway — Bloor Street East145 m
- restaurant — Booster Juice146 m
- retail146 m
- restaurant — The Bagel Stop147 m
- restaurant — Sushi Shop149 m
- parking lot149 m
- retail — INS Market150 m
- cafe — Tim Hortons152 m
- restaurant — Salad Days156 m
- retail — Longo's157 m
- restaurant — El Gourmet159 m
- cafe — Starbucks161 m
- restaurant — Chipotle167 m
- cafe — Le Gourmand Café167 m
- rail169 m
- rail169 m
- parking lot171 m
- highway — Bloor Street East177 m
- retail — Salon Riccardo179 m
- cafe — Hale Coffee179 m
- highway — Bloor Street East180 m
- retail — Dollarama185 m
- retail — MN Nail Salon186 m
- restaurant — Tahini's187 m
- parking lot187 m
- rail — Bloor-Danforth Line188 m
- retail — Print Pros190 m
- rail — Bloor-Danforth Line191 m
- cafe — Presse Café198 m
- transit stop — Bloor St East Entrance199 m
Park profile
Five-axis radar across the structural dimensions.
Citywide percentile ranks
Across all Toronto parks in the dataset.
- Overall vitality90th
- Edge activation89th
- Connectivity95th
- Amenity diversity52th
- Natural comfort3th
- Enclosure97th
Most similar parks
Closest in metric space across the five structural dimensions.
- Winchester Square ParkCivic Square42
- Robertson ParketteUrban Plaza42
- Shaw St Traffic Median NorthCorridor / Linear Park48
- Roxborough - Yonge St Traffic IslandUrban Plaza43
- Bob Acton ParkNeighbourhood Park49
Most opposite parks
Furthest in metric space — useful for recognising what kind of park this isn’t.
- Trca Lands ( 26)Ravine / Naturalized Park27
- Toronto Islands - Muggs Island ParkRavine / Naturalized Park25
- Rouge ParkRavine / Naturalized Park28
- Rouge ParkWaterfront Park25
- Rouge ParkRavine / Naturalized Park26
Human activity signals
Programming, social attention, temporal rhythm, and nearby pedestrian / cycling flow. An experimental aggregate layer that complements the spatial scores — partial coverage, partial confidence.
Activity reading: pedestrian intensity 11.8/100; cycling/trail 19.6/100. The strongest signal is observed pedestrian/cycling activity. Source coverage: counters.
Does this score feel accurate?
Your read of Milner Parkettematters. We’re testing whether the model lines up with how people actually use the park. Submissions are stored locally; no account needed.
Tell us how this park feels
We measure structure (canopy, edges, connectivity). You measure feeling. Both matter — and disagreement is itself useful civic data.
What would improve this park?
Generated from the weakest measured dimensions — a starting point, not a prescription.
- Activate the edges: encourage cafés, retail or community uses on the streets that face the park; replace blank or parking-lot edges where possible.
- Diversify what people can do in the park — playground, washroom, water, shade, performance, sport, garden — even small additions raise this score.
- Increase canopy and reduce paved area. Shade and water features extend usable hours and seasons.
Data sources
- City of Toronto Open Data — Parks (Green Space)Polygon boundaries, official names, types.
- Parks & Recreation FacilitiesInventory of in-park amenities (washrooms, fields, rinks…).
- Toronto Pedestrian NetworkSidewalk segments around and through parks; estimated park entrances.
- Toronto Centreline V2Street segments + intersection nodes near park edges; trails and walkways.
- Toronto 3D MassingBuilding footprints + heights for edge-building counts, frontage density, and tower-in-the-park risk.
- Toronto Treed AreaTree canopy share inside park polygons via stratified-grid sampling.
- Toronto Waterbodies & RiversWater surface inside parks + nearest-water distance for cooling.
- Ravine & Natural Feature ProtectionRavine overlap as a cooling / natural-comfort signal.
- Toronto Street Tree InventoryTree count + density inside park polygons.
- Neighbourhood Profiles(Pending) Equity context proxy.
- OpenStreetMap (Overpass API)Cafés, restaurants, retail, transit stops, parking, highways, rail.