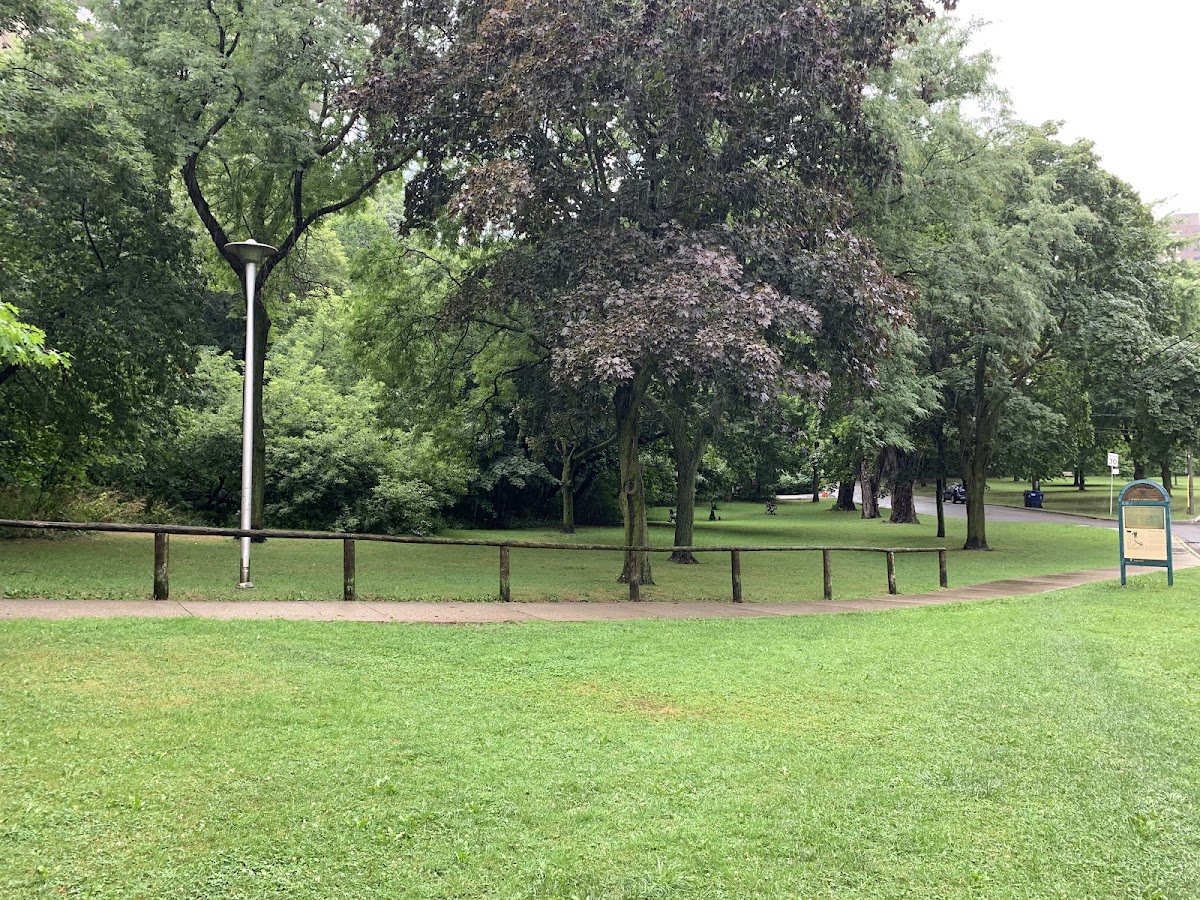
Lawren Harris Park
Ravine / Naturalized Park, in the top tier overall (score 44, rank ~88th percentile). Strongest: natural comfort; weakest: edge activation.
Photo by Michael M via Google Places · cached 5/9/2026
Lawren Harris Park scores 44.4 / 100. Strongest dimensions: enclosure / eyes on park and natural comfort. Weakest: amenity diversity (0). Border-vacuum risk is low. This score is a transparent reading of Jane Jacobs-style vitality factors, not a definitive judgment.
Area · 0.37 ha
Weighted across six dimensions · confidence 63%
Scores are not bell-curved. Percentiles and expected scores provide context without changing the underlying model.
Loading map…
The parks map is loading.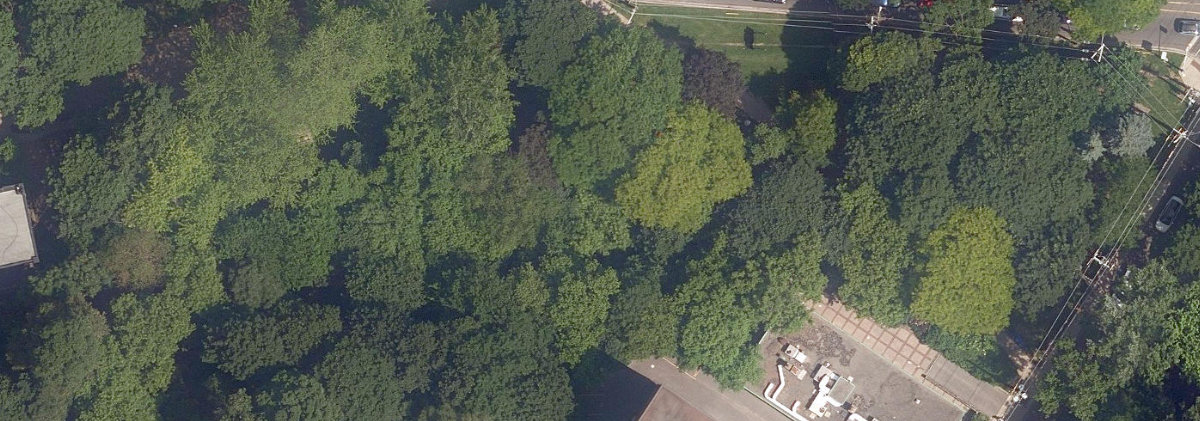
Explain this score
Where did the 44 come from? Each weighted contribution against a neutral 50 baseline. Green = pushed up; red = pulled down.
Sum of contributions = the headline score. A negative bar means that dimension dragged the park below the city-wide neutral baseline.
Why this park works
Lawren Harris Park works because its natural comfort score (88) is one of the city's strongest and its enclosure (90) is also top decile (89% tree canopy provides real shade; it sits inside the ravine system).
What limits this park
Lawren Harris Park is held back by edge activation (0, bottom quartile): the surrounding streets carry too few active uses to spill into the park.
Most distinctive characteristic
Most distinctive feature: exceptionally low edge activation (0, bottom quartile).
Jacobs reading
Lawren Harris Park sits between an urban social park and an ecological retreat: moderately useful for both, exceptionally suited to neither.
Tradeoffs
- The park is enclosed by buildings (90) but the surrounding streets are quiet (edge activation 0): frame without animation.
Performance in context
- This park is a strong overperformer for its cohort: raw 44 versus an expected 32 for similar parks (small Ravine / Naturalized Park ravine) (gap +12).
Typology classification
Classified as Ravine / Naturalized Park: 100% ravine overlap, 89% canopy
Edge Activation
Within 100 m of the park edge: 0 active uses (none) and 2 dead/hostile uses (parking_lot). Active edges keep "eyes on the park" through the day; parking lots, blank institutional walls, rail and highway frontages drain street life.
Source: OSM POIs (amenity/shop) + Toronto Building Footprints + land use
Connectivity
Connectivity blends paths, intersections, transit, entrances, and edge density. This park has 2 mapped paths/walkways and 15 sidewalk segments within 50 m; 14 street intersections within 100 m; 26 transit stops within a 400 m walk; 2 estimated access points across ~333 m of perimeter. edge density is healthy, no superblock penalty. Source coverage: centreline, pedestrian_network, transit_osm.
Source: Toronto Centreline V2 + Pedestrian Network + OSM transit stops
Amenity Diversity
No amenities recorded. Score is 0 until inventory is loaded.
Source: Toronto Parks & Recreation Facilities + OSM amenity tags
Natural Comfort
Natural-comfort components for this park: 88.5% estimated tree canopy; 100.0% inside the ravine system; nearest waterbody ~864 m; 1 city-mapped trees inside the polygon (1.0/ha). Reading: ravine-cooled. Source coverage: treed_area, ravine, waterbodies, street_trees. Impervious surface is approximated (Toronto's authoritative layer ships only as a raster GeoTIFF).
Source: Toronto Treed Area + Ravine + Waterbodies + Street Tree Inventory
Enclosure / Eyes on Park
42 buildings within 25 m of the park edge (19 mid-rise, 19 low-rise, 4 tower); avg edge height 16.0 m (~5 floors); 12.6 buildings per 100 m of 333 m perimeter (strong frontage density); edges are at a Jacobs-scale walkable mid-rise (3 to 7 floors); 4 towers ≥ 40 m within 25 m of the edge. "Eyes on the park" come strongest from the 19 mid-rise edge buildings.
Source: Toronto 3D Massing (building footprints + heights)
Border Vacuum Risk
Border-vacuum factors within 50 m of the park: parking_lot. Jacobs warned that highways, rail, parking lots and blank institutional edges act as "vacuums" that suppress foot traffic and isolate the park from its neighbourhood.
Source: Toronto Street Centreline (highways) + rail layer + OSM landuse + building footprints
Equity Context
Equity Context requires inputs not yet loaded for this park (Toronto Neighbourhood Profiles). Score is held at a neutral 50 with low confidence. Read with caution.
Source: Toronto Neighbourhood Profiles
Amenities (0)
No amenities recorded for this park.
Nearby active-edge features (48)
- parking lot5 m
- parking lot84 m
- parking lot114 m
- parking lot114 m
- retail: Vivid Cleaners & Alterations119 m
- restaurant: El Gourmet120 m
- retail: Rabba125 m
- restaurant: Pizza Hut Express126 m
- rail132 m
- rail132 m
- retail: Canadian Tire134 m
- retail: Canadian Tire Auto Service137 m
- parking lot144 m
- retail: Beauté d’Amour Nails Studio146 m
- restaurant: Kiro Sushi148 m
- retail: Milan Condominiums151 m
- parking lot153 m
- transit stop: Church Street159 m
- retail: Topcuts160 m
- restaurant: hot dog stand160 m
- restaurant: Lee Chen Asian Bistro162 m
- restaurant: Mamma's Pizza163 m
- restaurant: Burrito Boyz163 m
- retail: Weedjar164 m
- highway: Yonge Street167 m
- highway: Yonge Street167 m
- highway: Yonge Street168 m
- restaurant: Villa Madina172 m
- parking lot173 m
- highway: Yonge Street177 m
- transit stop: Davenport Road179 m
- restaurant: Subway180 m
- restaurant: Thaï Express182 m
- restaurant: Randy’s Roti & Doubles183 m
- retail: The Vaper Store183 m
- restaurant: Fat Lamb Kouzina Homemade Greek Food184 m
- transit stop186 m
- retail188 m
- highway: Yonge Street188 m
- retail: Petit Pied Kids189 m
- retail: Mille Luce Designs Inc.190 m
- restaurant: BiBab Express Sushi & Rolls191 m
- restaurant: Crown & Dragon Restaurant192 m
- restaurant: La Prep193 m
- restaurant: A&W194 m
- retail: Solo Bace197 m
- retail198 m
- retail: TCAF Shop199 m
Park profile
Five-axis radar across the structural dimensions.
Citywide percentile ranks
Across all Toronto parks in the dataset.
- Overall vitality88th
- Edge activation1th
- Connectivity86th
- Amenity diversity1th
- Natural comfort97th
- Enclosure96th
Most similar parks
Closest in metric space across the five structural dimensions.
- Todmorden Mills ParkRavine / Naturalized Park34
- Nordheimer RavineRavine / Naturalized Park44
- Mount Pleasant CemeteryOther36
- Cedarvale RavineRavine / Naturalized Park40
- Rosedale Ravine LandsRavine / Naturalized Park37
Most opposite parks
Furthest in metric space. Useful for recognising what kind of park this isn’t.
- Queen'S Quay Traffic IslandWaterfront Park49
- Danforth Gardens ParkParkette42
- Rouge ParkRavine / Naturalized Park18
- Trca Lands ( 58)Waterfront Park18
- Toronto Islands - Island ParkWaterfront Park52
Visitor signals
Public attention measured by Google Places aggregates. This proxies attention, not occupancy. Aggregate-only: no usernames, no review text, no extra photos beyond the cached hero.
p57 citywide · p65 within Ravine / Naturalized Park
Source: Google Places API · match high (0.97 composite confidence) · last refreshed 5/9/2026. Privacy contract. Measures public attention, not occupancy.
Human activity signals: not available
No activity signals have landed for this park yet. The model has scored its physical form but it can’t yet say how often it’s programmed, photographed, or walked through. See /data-ethics for what we will and will not collect.
Does this score feel accurate?
Your read of Lawren Harris Parkmatters. We’re testing whether the model lines up with how people actually use the park. Submissions are stored locally; no account needed.
Tell us how this park feels
We measure structure (canopy, edges, connectivity). You measure feeling. Both matter, and disagreement is itself useful civic data.
What would improve this park?
Generated from the weakest measured dimensions: a starting point, not a prescription.
- Activate the edges: encourage cafés, retail or community uses on the streets that face the park; replace blank or parking-lot edges where possible.
- Diversify what people can do in the park (playground, washroom, water, shade, performance, sport, garden): even small additions raise this score.
Data sources
- City of Toronto Open Data: Parks (Green Space)Polygon boundaries, official names, types.
- Parks & Recreation FacilitiesInventory of in-park amenities (washrooms, fields, rinks…).
- Toronto Pedestrian NetworkSidewalk segments around and through parks; estimated park entrances.
- Toronto Centreline V2Street segments + intersection nodes near park edges; trails and walkways.
- Toronto 3D MassingBuilding footprints + heights for edge-building counts, frontage density, and tower-in-the-park risk.
- Toronto Treed AreaTree canopy share inside park polygons via stratified-grid sampling.
- Toronto Waterbodies & RiversWater surface inside parks + nearest-water distance for cooling.
- Ravine & Natural Feature ProtectionRavine overlap as a cooling / natural-comfort signal.
- Toronto Street Tree InventoryTree count + density inside park polygons.
- Neighbourhood Profiles(Pending) Equity context proxy.
- OpenStreetMap (Overpass API)Cafés, restaurants, retail, transit stops, parking, highways, rail.