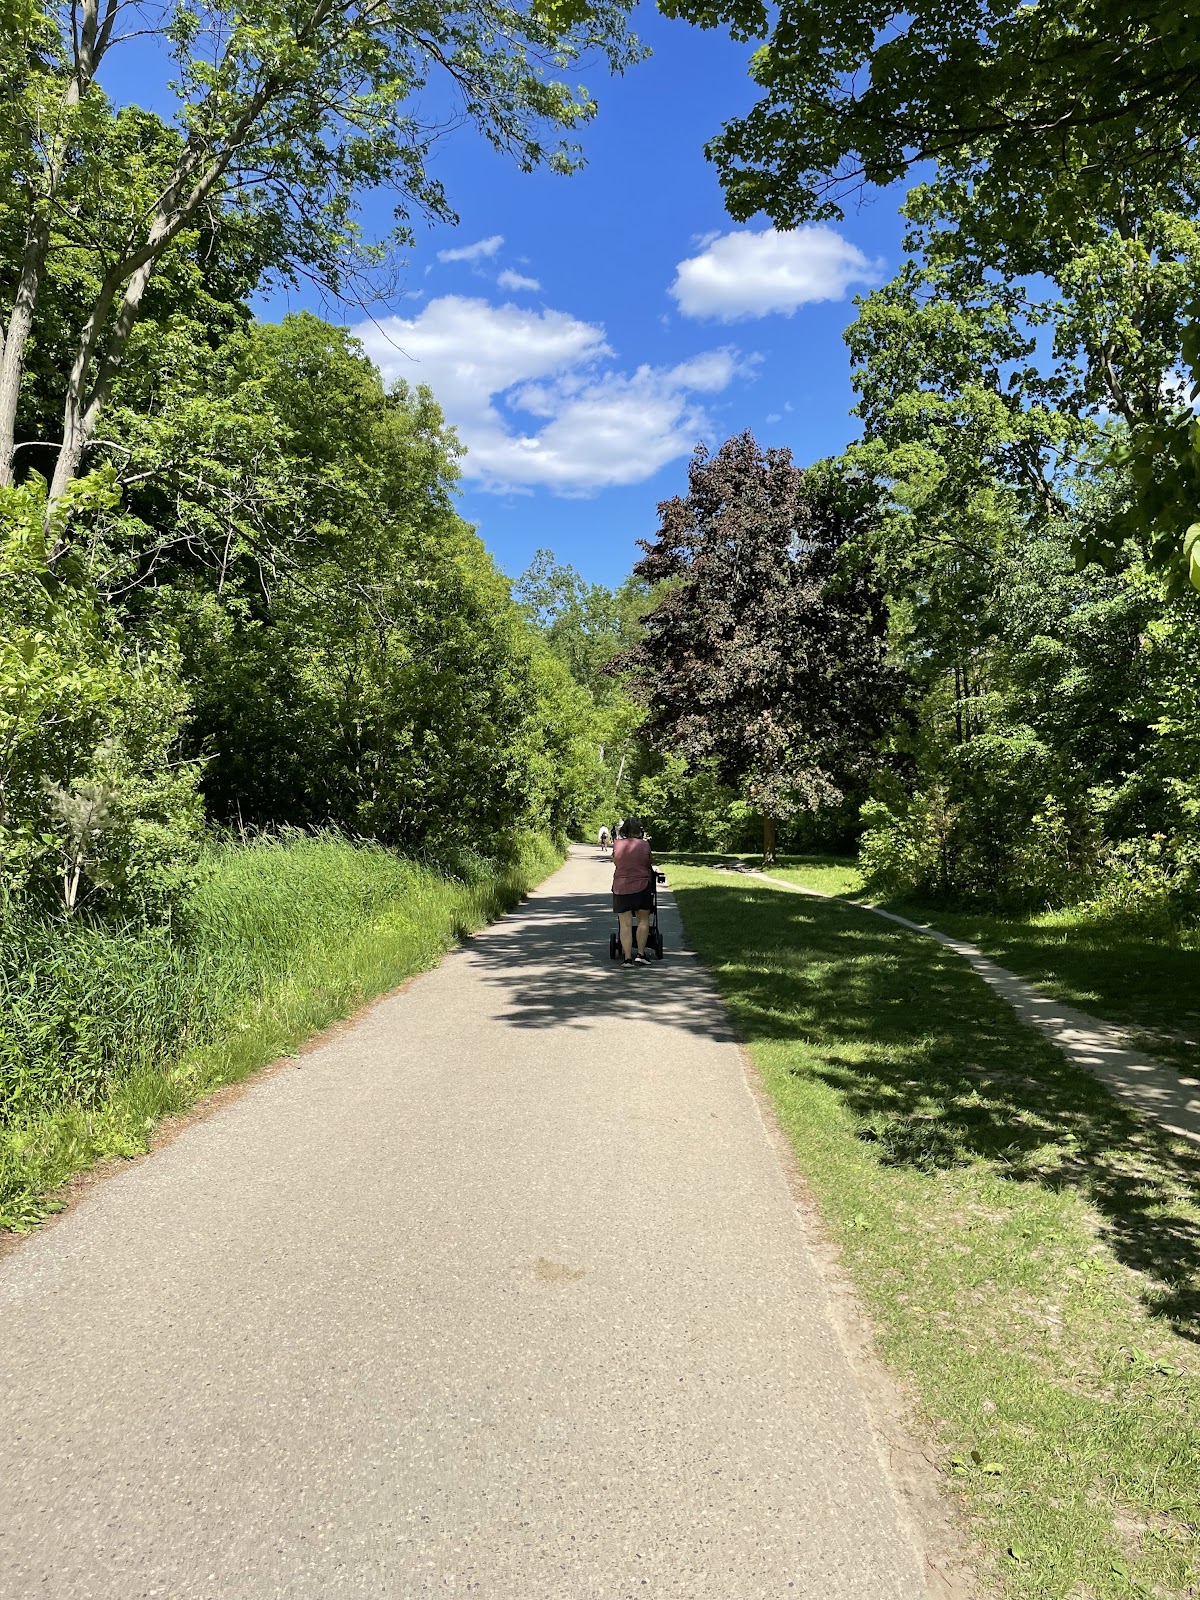
Coxwell Ravine Park
Ravine / Naturalized Park, in the top tier overall (score 47, rank ~92th percentile). Strongest: edge activation; weakest: natural comfort.
Photo by RJ via Google Places · cached 5/9/2026
Coxwell Ravine Park scores 46.9 / 100. Strongest dimensions: enclosure / eyes on park and edge activation. Weakest: amenity diversity (21). Border-vacuum risk is low. This score is a transparent reading of Jane Jacobs-style vitality factors, not a definitive judgment.
Area · 8.29 ha
Weighted across six dimensions · confidence 68%
Scores are not bell-curved. Percentiles and expected scores provide context without changing the underlying model.
Loading map…
The parks map is loading.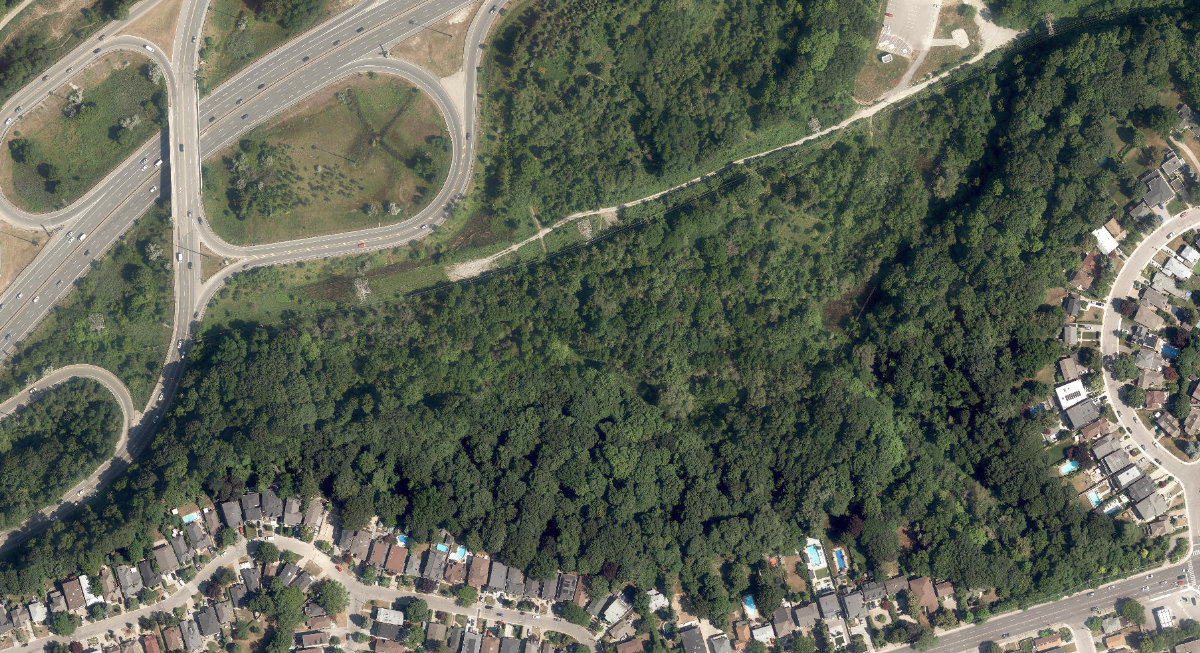
Explain this score
Where did the 47 come from? Each weighted contribution against a neutral 50 baseline. Green = pushed up; red = pulled down.
Sum of contributions = the headline score. A negative bar means that dimension dragged the park below the city-wide neutral baseline.
Why this park works
Coxwell Ravine Park works because its edge activation score (49) is one of the city's strongest and its amenity diversity (21) is also top quartile.
What limits this park
Coxwell Ravine Park is held back by natural comfort (34, bottom quartile): only 0% canopy means little summer shade.
Most distinctive characteristic
Most distinctive feature: exceptionally high edge activation (49, top decile).
Jacobs reading
Coxwell Ravine Park sits between an urban social park and an ecological retreat: moderately useful for both, exceptionally suited to neither.
Performance in context
- A modest overperformer for its ravine / naturalized park typology (+11 vs the median in large Ravine / Naturalized Park ravine).
Typology classification
Classified as Ravine / Naturalized Park: 100% ravine overlap, 0% canopy. Secondary read: Neighbourhood Park (8.3 ha, framed by 2 mid-rise vs 0 towers).
Edge Activation
Within 100 m of the park edge: 11 active uses (transit_stop, retail, restaurant) and 2 dead/hostile uses (highway, parking_lot). Active edges keep "eyes on the park" through the day; parking lots, blank institutional walls, rail and highway frontages drain street life.
Source: OSM POIs (amenity/shop) + Toronto Building Footprints + land use
Connectivity
Connectivity blends paths, intersections, transit, entrances, and edge density. This park has 0 mapped paths/walkways and 7 sidewalk segments within 50 m; 12 street intersections within 100 m; 20 transit stops within a 400 m walk; 0 estimated access points across ~1,929 m of perimeter. low edge density, significant superblock penalty applied. Source coverage: centreline, pedestrian_network, transit_osm.
Source: Toronto Centreline V2 + Pedestrian Network + OSM transit stops
Amenity Diversity
2 distinct amenity types in the park (dog_area, picnic). Diversity, not raw count, drives the score so a park with many distinct activity types can outrank a larger park that repeats the same use.
Source: Toronto Parks & Recreation Facilities + OSM amenity tags
Natural Comfort
Natural-comfort components for this park: 0.0% estimated tree canopy; 100.0% inside the ravine system; nearest waterbody ~351 m. Reading: ravine-cooled. Source coverage: ravine, waterbodies. Impervious surface is approximated (Toronto's authoritative layer ships only as a raster GeoTIFF).
Source: Toronto Treed Area + Ravine + Waterbodies + Street Tree Inventory
Enclosure / Eyes on Park
128 buildings within 25 m of the park edge (2 mid-rise, 126 low-rise, 0 tower); avg edge height 5.6 m (~2 floors); 6.6 buildings per 100 m of 1,929 m perimeter (strong frontage density); edges are barely there or single-storey; no towers immediately adjacent. "Eyes on the park" come strongest from the 2 mid-rise edge buildings.
Source: Toronto 3D Massing (building footprints + heights)
Border Vacuum Risk
Park edges face the city. No significant border vacuum detected.
Source: Toronto Street Centreline (highways) + rail layer + OSM landuse + building footprints
Equity Context
Equity Context requires inputs not yet loaded for this park (Toronto Neighbourhood Profiles). Score is held at a neutral 50 with low confidence. Read with caution.
Source: Toronto Neighbourhood Profiles
Amenities (2 types · 2 records)
- dog area
- picnic
Nearby active-edge features (44)
- transit stop: O'Connor Drive35 m
- retail: Shell49 m
- transit stop: Coxwell Avenue50 m
- parking lot62 m
- restaurant: Mr. Sub77 m
- transit stop: O'Connor Drive81 m
- retail: the neighbourhood joint82 m
- transit stop: O'Connor Drive84 m
- transit stop: Coxwell Avenue84 m
- highway: Don Valley Parkway92 m
- retail: Wayne's Supermarket93 m
- retail: Esso99 m
- restaurant: Skara99 m
- retail: Circle K104 m
- restaurant: Butter Chicken Roti106 m
- cafe: Tim Hortons106 m
- retail: pulp & paperie107 m
- retail: mon K patisserie111 m
- retail: Royal Cuts Barbershop112 m
- transit stop: Milton Road113 m
- parking lot116 m
- cafe: Ballissimo Loukoumades Bar116 m
- transit stop: Milton Road118 m
- restaurant: Eden Chinese Food120 m
- retail: Lucky Variety124 m
- highway: Don Valley Parkway125 m
- restaurant: Sushi Bay130 m
- highway: Don Valley Parkway132 m
- restaurant: Free Topping Pizza132 m
- retail: Coxwell Milk Convenience136 m
- parking lot138 m
- transit stop: Derwyn Road139 m
- highway: Don Valley Parkway139 m
- highway: Don Valley Parkway146 m
- parking lot150 m
- retail: What's in Fashion154 m
- parking lot157 m
- transit stop: Derwyn Road163 m
- highway: Don Valley Parkway180 m
- retail: LCBO181 m
- highway: Don Valley Parkway189 m
- retail: Julie Nails190 m
- restaurant: Little Coxwell Restaurant196 m
- highway: Don Valley Parkway200 m
Park profile
Five-axis radar across the structural dimensions.
Citywide percentile ranks
Across all Toronto parks in the dataset.
- Overall vitality92th
- Edge activation95th
- Connectivity48th
- Amenity diversity89th
- Natural comfort19th
- Enclosure34th
Most similar parks
Closest in metric space across the five structural dimensions.
- Weston Village ParkParkette39
- FRANK OKE SECONDARY SCHOOL - Building GroundsNeighbourhood Park49
- DON MILLS CIVITAN ARENA - Building GroundsUrban Plaza41
- York Street Off Ramp ParkCivic Square41
- Pellatt ParketteParkette39
Most opposite parks
Furthest in metric space. Useful for recognising what kind of park this isn’t.
- Trca Lands ( 26)Ravine / Naturalized Park27
- Toronto Islands - Muggs Island ParkRavine / Naturalized Park25
- Rouge ParkRavine / Naturalized Park28
- Rouge ParkRavine / Naturalized Park26
- Rouge ParkWaterfront Park25
Visitor signals
Public attention measured by Google Places aggregates. This proxies attention, not occupancy. Aggregate-only: no usernames, no review text, no extra photos beyond the cached hero.
“Part of the East Don Valley Trail system, this park offers picnic areas & wildlife viewing.” (Google editorial summary)
p21 citywide · p27 within Ravine / Naturalized Park
Source: Google Places API · match high (1.00 composite confidence) · last refreshed 5/9/2026. Privacy contract. Measures public attention, not occupancy.
Human activity signals: not available
No activity signals have landed for this park yet. The model has scored its physical form but it can’t yet say how often it’s programmed, photographed, or walked through. See /data-ethics for what we will and will not collect.
Does this score feel accurate?
Your read of Coxwell Ravine Parkmatters. We’re testing whether the model lines up with how people actually use the park. Submissions are stored locally; no account needed.
Tell us how this park feels
We measure structure (canopy, edges, connectivity). You measure feeling. Both matter, and disagreement is itself useful civic data.
What would improve this park?
Generated from the weakest measured dimensions: a starting point, not a prescription.
- Activate the edges: encourage cafés, retail or community uses on the streets that face the park; replace blank or parking-lot edges where possible.
- Add or open more entrances and improve sidewalk continuity around the park. More permeability means more spontaneous use.
- Diversify what people can do in the park (playground, washroom, water, shade, performance, sport, garden): even small additions raise this score.
- Increase canopy and reduce paved area. Shade and water features extend usable hours and seasons.
Data sources
- City of Toronto Open Data: Parks (Green Space)Polygon boundaries, official names, types.
- Parks & Recreation FacilitiesInventory of in-park amenities (washrooms, fields, rinks…).
- Toronto Pedestrian NetworkSidewalk segments around and through parks; estimated park entrances.
- Toronto Centreline V2Street segments + intersection nodes near park edges; trails and walkways.
- Toronto 3D MassingBuilding footprints + heights for edge-building counts, frontage density, and tower-in-the-park risk.
- Toronto Treed AreaTree canopy share inside park polygons via stratified-grid sampling.
- Toronto Waterbodies & RiversWater surface inside parks + nearest-water distance for cooling.
- Ravine & Natural Feature ProtectionRavine overlap as a cooling / natural-comfort signal.
- Toronto Street Tree InventoryTree count + density inside park polygons.
- Neighbourhood Profiles(Pending) Equity context proxy.
- OpenStreetMap (Overpass API)Cafés, restaurants, retail, transit stops, parking, highways, rail.