Westview Greenbelt
Ravine / Naturalized Park, middle of the pack overall (score 31, rank ~35th percentile). Strongest: natural comfort; weakest: edge activation.
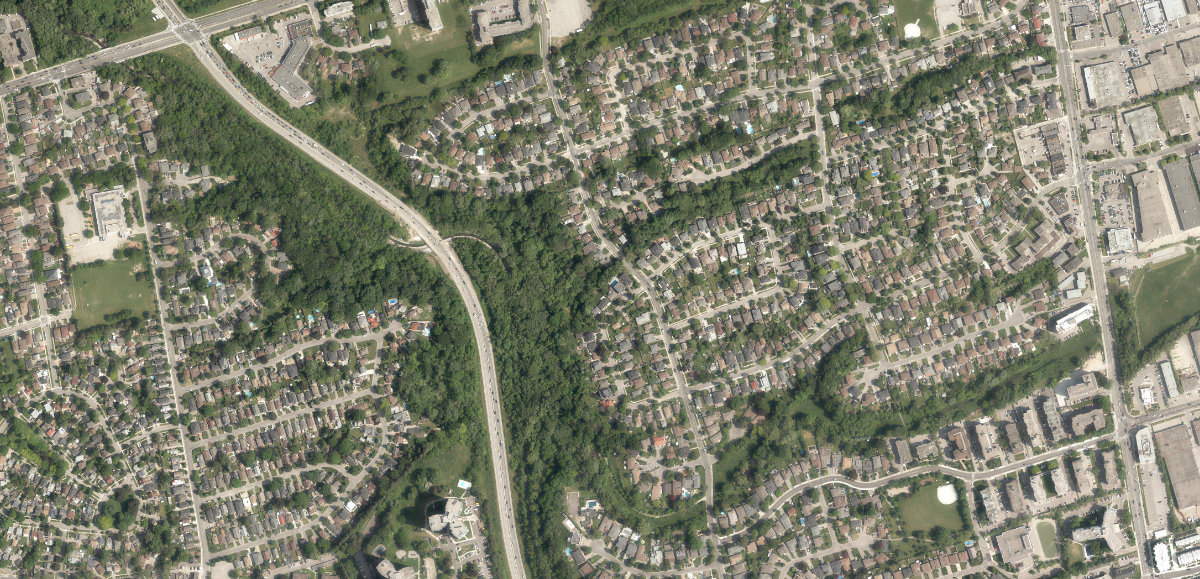
Aerial, City of Toronto orthophoto, ~8 cm/px source · cached 5/9/2026
Westview Greenbelt scores 31 / 100. Strongest dimensions: natural comfort and connectivity. Weakest: amenity diversity (0). Border-vacuum risk is elevated (100). This score is a transparent reading of Jane Jacobs-style vitality factors, not a definitive judgment.
Area · 15.61 ha
Weighted across six dimensions · confidence 63%
Scores are not bell-curved. Percentiles and expected scores provide context without changing the underlying model.
Loading map…
The parks map is loading.Explain this score
Where did the 31 come from? Each weighted contribution against a neutral 50 baseline. Green = pushed up; red = pulled down.
Sum of contributions = the headline score. A negative bar means that dimension dragged the park below the city-wide neutral baseline.
Why this park works
Westview Greenbelt works because its natural comfort score (76) is in the top tier and its connectivity (68) is also top quartile (40% tree canopy provides real shade; it sits inside the ravine system).
What limits this park
Westview Greenbelt's edges are fronted by border-vacuum land uses (highways, rail, parking, blank institutional), risk score 100.
Most distinctive characteristic
Most distinctive feature: exceptionally high natural comfort (76, top quartile).
Jacobs reading
Westview Greenbelt sits between an urban social park and an ecological retreat: moderately useful for both, exceptionally suited to neither.
Tradeoffs
- The park is enclosed by buildings (61) but the surrounding streets are quiet (edge activation 0): frame without animation.
- High connectivity coexists with high border-vacuum risk (100): much of that connectivity is to highways, rail, or parking lots, not to neighbourhoods.
Typology classification
Classified as Ravine / Naturalized Park: 100% ravine overlap, 40% canopy. Secondary read: Corridor / Linear Park (shape elongation 4.4× a circle of equal area).
Edge Activation
Within 100 m of the park edge: 13 active uses (transit_stop, restaurant, retail) and 11 dead/hostile uses (highway, parking_lot). Active edges keep "eyes on the park" through the day; parking lots, blank institutional walls, rail and highway frontages drain street life.
Source: OSM POIs (amenity/shop) + Toronto Building Footprints + land use
Connectivity
Connectivity blends paths, intersections, transit, entrances, and edge density. This park has 3 mapped paths/walkways and 58 sidewalk segments within 50 m; 28 street intersections within 100 m; 36 transit stops within a 400 m walk; 2 estimated access points across ~6,099 m of perimeter. low edge density, significant superblock penalty applied. Source coverage: centreline, pedestrian_network, transit_osm.
Source: Toronto Centreline V2 + Pedestrian Network + OSM transit stops
Amenity Diversity
No amenities recorded. Score is 0 until inventory is loaded.
Source: Toronto Parks & Recreation Facilities + OSM amenity tags
Natural Comfort
Natural-comfort components for this park: 40.4% estimated tree canopy; 100.0% inside the ravine system; 2.8% water surface; 84 city-mapped trees inside the polygon (5.4/ha). Reading: ravine-cooled. Source coverage: treed_area, ravine, waterbodies, street_trees. Impervious surface is approximated (Toronto's authoritative layer ships only as a raster GeoTIFF).
Source: Toronto Treed Area + Ravine + Waterbodies + Street Tree Inventory
Enclosure / Eyes on Park
330 buildings within 25 m of the park edge (22 mid-rise, 308 low-rise, 0 tower); avg edge height 5.7 m (~2 floors); 5.4 buildings per 100 m of 6,099 m perimeter (strong frontage density); edges are barely there or single-storey; no towers immediately adjacent. "Eyes on the park" come strongest from the 22 mid-rise edge buildings.
Source: Toronto 3D Massing (building footprints + heights)
Border Vacuum Risk
Border-vacuum factors within 50 m of the park: Black Creek Drive, Black Creek Drive, Black Creek Drive, Black Creek Drive, Black Creek Drive, parking_lot, Black Creek Drive, Black Creek Drive. Jacobs warned that highways, rail, parking lots and blank institutional edges act as "vacuums" that suppress foot traffic and isolate the park from its neighbourhood.
Source: Toronto Street Centreline (highways) + rail layer + OSM landuse + building footprints
Equity Context
Equity Context requires inputs not yet loaded for this park (Toronto Neighbourhood Profiles). Score is held at a neutral 50 with low confidence. Read with caution.
Source: Toronto Neighbourhood Profiles
Amenities (0)
No amenities recorded for this park.
Nearby active-edge features (53)
- transit stop: Gulliver Road3 m
- parking lot16 m
- highway: Black Creek Drive19 m
- transit stop21 m
- highway: Black Creek Drive21 m
- transit stop: 70 Gulliver Road22 m
- highway: Black Creek Drive24 m
- transit stop: Culford Road27 m
- highway: Black Creek Drive29 m
- highway: Black Creek Drive30 m
- highway: Black Creek Drive32 m
- highway: Black Creek Drive34 m
- transit stop: Woolton Crescent37 m
- transit stop: George Anderson Drive37 m
- transit stop: Ridge Point Crescent56 m
- highway: Black Creek Drive58 m
- transit stop: Harrow Drive61 m
- highway: Black Creek Drive69 m
- transit stop: Lawrence Ave at Brookhaven Dr82 m
- restaurant: O Patio Churrasqueira82 m
- retail: Superking Supermarket88 m
- parking lot90 m
- transit stop: Flamborough Drive96 m
- restaurant: Pizza Hut99 m
- parking lot102 m
- transit stop: Flamborough Drive104 m
- transit stop: Brookhaven Drive108 m
- restaurant: Red & White Mediterranean Restaurant109 m
- transit stop: Gulliver Road109 m
- restaurant: Mama's Tofu115 m
- transit stop: Gulliver Rd at Keele St119 m
- restaurant: Pho Bo To121 m
- highway: Black Creek Drive123 m
- highway: Black Creek Drive127 m
- parking lot137 m
- transit stop: Gulliver Rd at Keele St145 m
- parking lot146 m
- retail149 m
- cafe: Las Americas Cafe152 m
- restaurant: Dynasty House153 m
- retail: Sweet Petals156 m
- transit stop: Ingram Drive156 m
- retail: Song Vu160 m
- retail: Bluebird Self Storage160 m
- retail: Tops Variety162 m
- retail165 m
- retail: Dulce Aroma167 m
- parking lot171 m
- parking lot173 m
- parking lot175 m
- parking lot176 m
- retail: Money Mart186 m
- restaurant: Chopstixpress191 m
Park profile
Five-axis radar across the structural dimensions.
Citywide percentile ranks
Across all Toronto parks in the dataset.
- Overall vitality35th
- Edge activation38th
- Connectivity87th
- Amenity diversity44th
- Natural comfort88th
- Enclosure41th
Most similar parks
Closest in metric space across the five structural dimensions.
- Bendale ParkWaterfront Park40
- Humber MarshesWaterfront Park31
- Charles Sauriol Conservation AreaRavine / Naturalized Park38
- Public Access PropertyCorridor / Linear Park40
- Black Creek ParklandWaterfront Park32
Most opposite parks
Furthest in metric space. Useful for recognising what kind of park this isn’t.
- Joseph Burr Tyrrell ParkUrban Plaza50
- Leslie Grove ParkParkette68
- ALEX WILSON COMMUNITY GARDEN - Open Green SpaceUrban Plaza59
- Bernard Avenue Road AllowanceUrban Plaza54
- Queen'S Quay Traffic IslandWaterfront Park49
Human activity signals: not available
No activity signals have landed for this park yet. The model has scored its physical form but it can’t yet say how often it’s programmed, photographed, or walked through. See /data-ethics for what we will and will not collect.
Does this score feel accurate?
Your read of Westview Greenbeltmatters. We’re testing whether the model lines up with how people actually use the park. Submissions are stored locally; no account needed.
Tell us how this park feels
We measure structure (canopy, edges, connectivity). You measure feeling. Both matter, and disagreement is itself useful civic data.
What would improve this park?
Generated from the weakest measured dimensions: a starting point, not a prescription.
- Activate the edges: encourage cafés, retail or community uses on the streets that face the park; replace blank or parking-lot edges where possible.
- Diversify what people can do in the park (playground, washroom, water, shade, performance, sport, garden): even small additions raise this score.
- Mitigate border vacuums (highways, rail, parking) with active programming on the still-permeable edges and treat the hostile edge as a design challenge.
Data sources
- City of Toronto Open Data: Parks (Green Space)Polygon boundaries, official names, types.
- Parks & Recreation FacilitiesInventory of in-park amenities (washrooms, fields, rinks…).
- Toronto Pedestrian NetworkSidewalk segments around and through parks; estimated park entrances.
- Toronto Centreline V2Street segments + intersection nodes near park edges; trails and walkways.
- Toronto 3D MassingBuilding footprints + heights for edge-building counts, frontage density, and tower-in-the-park risk.
- Toronto Treed AreaTree canopy share inside park polygons via stratified-grid sampling.
- Toronto Waterbodies & RiversWater surface inside parks + nearest-water distance for cooling.
- Ravine & Natural Feature ProtectionRavine overlap as a cooling / natural-comfort signal.
- Toronto Street Tree InventoryTree count + density inside park polygons.
- Neighbourhood Profiles(Pending) Equity context proxy.
- OpenStreetMap (Overpass API)Cafés, restaurants, retail, transit stops, parking, highways, rail.