Beecroft Linear Park
Corridor / Linear Park, one of the city's strongest overall (score 52, rank ~97th percentile). Strongest: connectivity; weakest: amenity diversity.
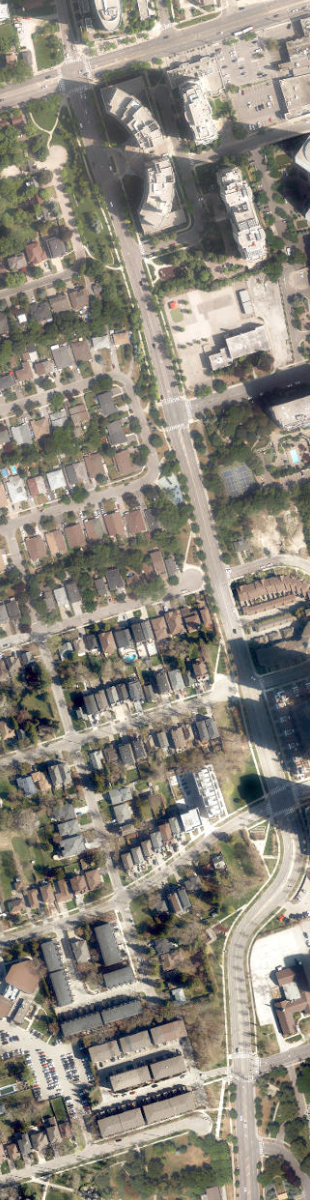
Aerial, City of Toronto orthophoto, ~8 cm/px source · cached 5/9/2026
Beecroft Linear Park scores 51.9 / 100. Strongest dimensions: enclosure / eyes on park and connectivity. Weakest: amenity diversity (11.9). Border-vacuum risk is low. This score is a transparent reading of Jane Jacobs-style vitality factors, not a definitive judgment.
Area · 1.06 ha
Weighted across six dimensions · confidence 70%
Scores are not bell-curved. Percentiles and expected scores provide context without changing the underlying model.
Loading map…
The parks map is loading.Explain this score
Where did the 52 come from? Each weighted contribution against a neutral 50 baseline. Green = pushed up; red = pulled down.
Sum of contributions = the headline score. A negative bar means that dimension dragged the park below the city-wide neutral baseline.
Why this park works
Beecroft Linear Park works because its connectivity score (75) is one of the city's strongest and its enclosure (87) is also top decile (39 transit stops sit within a 400 m walk; 33 intersections fall within 100 m of the edge).
What limits this park
Beecroft Linear Park doesn't have a clear weakness. Every measured dimension is at or above the middle of the pack.
Most distinctive characteristic
Most distinctive feature: exceptionally high connectivity (75, top decile).
Jacobs reading
Beecroft Linear Park sits between an urban social park and an ecological retreat: moderately useful for both, exceptionally suited to neither.
Performance in context
- This park is a strong overperformer for its cohort: raw 52 versus an expected 37 for similar parks (medium Corridor / Linear Park) (gap +15).
Typology classification
Classified as Corridor / Linear Park: shape elongation 3.7× a circle of equal area. Secondary read: Neighbourhood Park (1.1 ha, framed by 48 mid-rise vs 20 towers).
Edge Activation
Within 100 m of the park edge: 12 active uses (transit_stop, restaurant, school, retail, cafe) and 5 dead/hostile uses (parking_lot). Active edges keep "eyes on the park" through the day; parking lots, blank institutional walls, rail and highway frontages drain street life.
Source: OSM POIs (amenity/shop) + Toronto Building Footprints + land use
Connectivity
Connectivity blends paths, intersections, transit, entrances, and edge density. This park has 3 mapped paths/walkways and 46 sidewalk segments within 50 m; 33 street intersections within 100 m; 39 transit stops within a 400 m walk; 2 estimated access points across ~1,339 m of perimeter. edge density is healthy, no superblock penalty. Source coverage: centreline, pedestrian_network, transit_osm.
Source: Toronto Centreline V2 + Pedestrian Network + OSM transit stops
Amenity Diversity
1 distinct amenity types in the park (playground). Diversity, not raw count, drives the score so a park with many distinct activity types can outrank a larger park that repeats the same use.
Source: Toronto Parks & Recreation Facilities + OSM amenity tags
Natural Comfort
Natural-comfort components for this park: ~53.7% effective canopy (14.3% from contiguous tree polygons + scattered tree density); nearest waterbody ~1424 m; 81 city-mapped trees inside the polygon (76.7/ha). Reading: well-shaded. Source coverage: treed_area, waterbodies, street_trees. Impervious surface is approximated (Toronto's authoritative layer ships only as a raster GeoTIFF).
Source: Toronto Treed Area + Ravine + Waterbodies + Street Tree Inventory
Enclosure / Eyes on Park
147 buildings within 25 m of the park edge (48 mid-rise, 79 low-rise, 20 tower); avg edge height 14.8 m (~5 floors); 11.0 buildings per 100 m of 1,339 m perimeter (strong frontage density); edges are at a Jacobs-scale walkable mid-rise (3 to 7 floors); 20 towers ≥ 40 m within 25 m of the edge. "Eyes on the park" come strongest from the 48 mid-rise edge buildings.
Source: Toronto 3D Massing (building footprints + heights)
Border Vacuum Risk
Border-vacuum factors within 50 m of the park: parking_lot. Jacobs warned that highways, rail, parking lots and blank institutional edges act as "vacuums" that suppress foot traffic and isolate the park from its neighbourhood.
Source: Toronto Street Centreline (highways) + rail layer + OSM landuse + building footprints
Equity Context
Equity Context requires inputs not yet loaded for this park (Toronto Neighbourhood Profiles). Score is held at a neutral 50 with low confidence. Read with caution.
Source: Toronto Neighbourhood Profiles
Amenities (1 types · 1 records)
- playground
Nearby active-edge features (67)
- transit stop: Beecroft Road8 m
- parking lot36 m
- transit stop: Greenview Avenue49 m
- parking lot59 m
- restaurant: Yupdduk Finch63 m
- retail: Sheila Hair Salon66 m
- parking lot70 m
- retail: Electron Computer70 m
- cafe: Palgong Tea78 m
- parking lot81 m
- retail82 m
- parking lot: Fire and Ambulance Parking83 m
- retail: Puff n Purr84 m
- retail: TJ Convenience88 m
- school: Shining Through Centre89 m
- transit stop91 m
- restaurant: Cheers Chicken & Beers99 m
- cafe: Rosey J Cafe105 m
- restaurant: Huh Ga Ne112 m
- parking lot117 m
- parking lot119 m
- cafe: CoCo Fresh Tea & Juice119 m
- retail: Hair Avenue124 m
- parking lot126 m
- parking lot128 m
- parking lot131 m
- retail: Joy Mart132 m
- parking lot133 m
- parking lot136 m
- restaurant: Subway138 m
- parking lot139 m
- parking lot143 m
- parking lot147 m
- parking lot147 m
- retail: Danmi Nails & Brows147 m
- retail: La La Wellness Centre148 m
- parking lot151 m
- parking lot152 m
- retail: Koko Hair Salon155 m
- retail: Hair I Am Studio158 m
- retail: Haiwai Travel160 m
- restaurant: Hot Impression160 m
- parking lot162 m
- parking lot162 m
- parking lot162 m
- parking lot162 m
- parking lot163 m
- retail: N Hair Salon164 m
- parking lot164 m
- retail: The OWL’s Meat Shop165 m
- parking lot166 m
- restaurant: Superhot166 m
- parking lot166 m
- cafe: Royaltea166 m
- parking lot167 m
- restaurant: Oh Geul Boh Geul Korean Restaurant167 m
- parking lot168 m
- restaurant: DakGoGi168 m
- restaurant: San Tong170 m
- parking lot173 m
- parking lot174 m
- transit stop: Yonge Street - Finch Station177 m
- transit stop: Yonge Street at Churchill Avenue180 m
- transit stop: Yonge St. @ Churchill Ave.181 m
- parking lot192 m
- highway: Yonge Street195 m
- parking lot197 m
Park profile
Five-axis radar across the structural dimensions.
Citywide percentile ranks
Across all Toronto parks in the dataset.
- Overall vitality97th
- Edge activation86th
- Connectivity95th
- Amenity diversity78th
- Natural comfort84th
- Enclosure93th
Most similar parks
Closest in metric space across the five structural dimensions.
- Ormskirk ParkRavine / Naturalized Park50
- Carlaw Avenue ParketteParkette50
- Wishing Well WoodsRavine / Naturalized Park47
- Suydam ParkRavine / Naturalized Park52
- Willis Blair ParketteParkette52
Most opposite parks
Furthest in metric space. Useful for recognising what kind of park this isn’t.
- Rouge ParkRavine / Naturalized Park18
- Trca Lands ( 58)Waterfront Park18
- Rouge ParkRavine / Naturalized Park21
- Toronto Islands - Muggs Island ParkRavine / Naturalized Park25
- Rouge ParkRavine / Naturalized Park19
Human activity signals: not available
No activity signals have landed for this park yet. The model has scored its physical form but it can’t yet say how often it’s programmed, photographed, or walked through. See /data-ethics for what we will and will not collect.
Does this score feel accurate?
Your read of Beecroft Linear Parkmatters. We’re testing whether the model lines up with how people actually use the park. Submissions are stored locally; no account needed.
Tell us how this park feels
We measure structure (canopy, edges, connectivity). You measure feeling. Both matter, and disagreement is itself useful civic data.
What would improve this park?
Generated from the weakest measured dimensions: a starting point, not a prescription.
- Activate the edges: encourage cafés, retail or community uses on the streets that face the park; replace blank or parking-lot edges where possible.
- Diversify what people can do in the park (playground, washroom, water, shade, performance, sport, garden): even small additions raise this score.
Data sources
- City of Toronto Open Data: Parks (Green Space)Polygon boundaries, official names, types.
- Parks & Recreation FacilitiesInventory of in-park amenities (washrooms, fields, rinks…).
- Toronto Pedestrian NetworkSidewalk segments around and through parks; estimated park entrances.
- Toronto Centreline V2Street segments + intersection nodes near park edges; trails and walkways.
- Toronto 3D MassingBuilding footprints + heights for edge-building counts, frontage density, and tower-in-the-park risk.
- Toronto Treed AreaTree canopy share inside park polygons via stratified-grid sampling.
- Toronto Waterbodies & RiversWater surface inside parks + nearest-water distance for cooling.
- Ravine & Natural Feature ProtectionRavine overlap as a cooling / natural-comfort signal.
- Toronto Street Tree InventoryTree count + density inside park polygons.
- Neighbourhood Profiles(Pending) Equity context proxy.
- OpenStreetMap (Overpass API)Cafés, restaurants, retail, transit stops, parking, highways, rail.