Downsview Park And Lawn Bowling Greens
Neighbourhood Park, near the bottom of the city overall (score 22, rank ~5th percentile). Strongest: amenity diversity; weakest: connectivity.
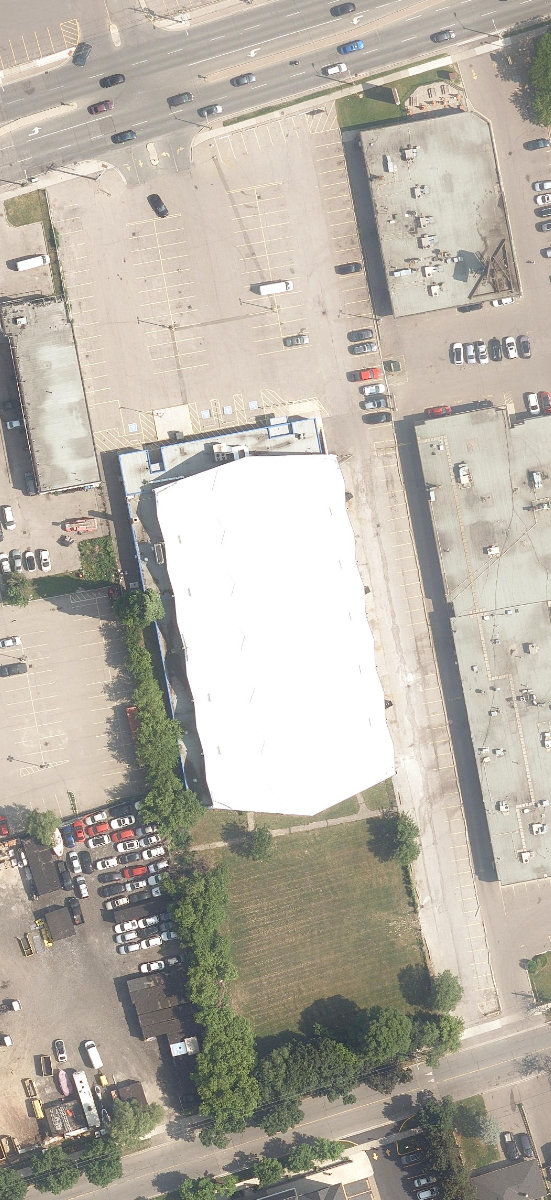
Aerial, City of Toronto orthophoto, ~8 cm/px source · cached 5/9/2026
Downsview Park And Lawn Bowling Greens scores 22 / 100. Strongest dimensions: enclosure / eyes on park and natural comfort. Weakest: edge activation (5.8). Border-vacuum risk is elevated (72). This score is a transparent reading of Jane Jacobs-style vitality factors, not a definitive judgment.
Area · 1.18 ha
Weighted across six dimensions · confidence 72%
Scores are not bell-curved. Percentiles and expected scores provide context without changing the underlying model.
Loading map…
The parks map is loading.Explain this score
Where did the 22 come from? Each weighted contribution against a neutral 50 baseline. Green = pushed up; red = pulled down.
Sum of contributions = the headline score. A negative bar means that dimension dragged the park below the city-wide neutral baseline.
Why this park works
Downsview Park And Lawn Bowling Greens works because its amenity diversity score (12) is above average and its edge activation (6) is also above-average.
What limits this park
Downsview Park And Lawn Bowling Greens is held back by connectivity (23, bottom quartile); border-vacuum risk is also elevated (72).
Most distinctive characteristic
Most distinctive feature: exceptionally low connectivity (23, bottom quartile).
Jacobs reading
Downsview Park And Lawn Bowling Greens is currently underperforming on both axes: neither integrated into the city nor offering deep natural respite. A candidate for design intervention.
Performance in context
- Strong underperformer relative to its cohort: raw 22 vs an expected 37 (gap -15).
Typology classification
Classified as Neighbourhood Park: 1.2 ha, framed by 1 mid-rise vs 0 towers
Edge Activation
Within 100 m of the park edge: 21 active uses (transit_stop, restaurant, retail) and 9 dead/hostile uses (parking_lot). Active edges keep "eyes on the park" through the day; parking lots, blank institutional walls, rail and highway frontages drain street life.
Source: OSM POIs (amenity/shop) + Toronto Building Footprints + land use
Connectivity
Connectivity blends paths, intersections, transit, entrances, and edge density. This park has 0 mapped paths/walkways and 3 sidewalk segments within 50 m; 1 street intersections within 100 m; 10 transit stops within a 400 m walk; 0 estimated access points across ~506 m of perimeter. low edge density, significant superblock penalty applied. Source coverage: centreline, pedestrian_network, transit_osm.
Source: Toronto Centreline V2 + Pedestrian Network + OSM transit stops
Amenity Diversity
1 distinct amenity types in the park (community_centre). Diversity, not raw count, drives the score so a park with many distinct activity types can outrank a larger park that repeats the same use.
Source: Toronto Parks & Recreation Facilities + OSM amenity tags
Natural Comfort
Natural-comfort components for this park: 1.2% estimated tree canopy; nearest waterbody ~433 m; 1 city-mapped trees inside the polygon (0.8/ha). Reading: exposed. Source coverage: treed_area, waterbodies, street_trees. Impervious surface is approximated (Toronto's authoritative layer ships only as a raster GeoTIFF).
Source: Toronto Treed Area + Ravine + Waterbodies + Street Tree Inventory
Enclosure / Eyes on Park
14 buildings within 25 m of the park edge (1 mid-rise, 13 low-rise, 0 tower); avg edge height 5.5 m (~2 floors); 2.8 buildings per 100 m of 506 m perimeter (moderate frontage density); edges are barely there or single-storey; no towers immediately adjacent. "Eyes on the park" come strongest from the 1 mid-rise edge buildings.
Source: Toronto 3D Massing (building footprints + heights)
Border Vacuum Risk
Border-vacuum factors within 50 m of the park: parking_lot, parking_lot, parking_lot, parking_lot, parking_lot, parking_lot. Jacobs warned that highways, rail, parking lots and blank institutional edges act as "vacuums" that suppress foot traffic and isolate the park from its neighbourhood.
Source: Toronto Street Centreline (highways) + rail layer + OSM landuse + building footprints
Equity Context
Equity Context requires inputs not yet loaded for this park (Toronto Neighbourhood Profiles). Score is held at a neutral 50 with low confidence. Read with caution.
Source: Toronto Neighbourhood Profiles
Amenities (1 types · 1 records)
- community centre
Nearby active-edge features (80)
- parking lot0 m
- transit stop: Dallner Road3 m
- restaurant: Carniceria El Gaucho7 m
- retail: Jerry's16 m
- retail: Kabul Foods Supermarket19 m
- retail: El Gaucho22 m
- retail: Juan Meat Market22 m
- retail: Hair CiCi24 m
- restaurant: Wild Wing24 m
- retail: Nguyen Huong Vietnamese Sandwiches24 m
- restaurant: La Guanaquita24 m
- retail: Chatr25 m
- restaurant: Pho Con Bo25 m
- retail: Saigon Optical25 m
- parking lot26 m
- parking lot32 m
- parking lot32 m
- retail: Imperial Autozone Inc.37 m
- parking lot38 m
- restaurant: Beverly Hills40 m
- retail: The Ultimate Cut43 m
- transit stop: Dallner Road44 m
- parking lot49 m
- retail: Blue Sky Supermarket64 m
- parking lot77 m
- retail: The Beer Store78 m
- retail: 7-Eleven79 m
- retail: Low Price Auto Sales81 m
- parking lot82 m
- parking lot83 m
- retail: CH Nails100 m
- retail: Wash N' Wear Coin Laundry101 m
- retail: Braids & Barber101 m
- restaurant: SunRise Caribbean Restaurant101 m
- restaurant: Pizza Pizza108 m
- retail: Have a Cigar109 m
- restaurant: Tung Hing Bakery111 m
- retail: New York Connection116 m
- retail: Sirens116 m
- retail: Red Nails II119 m
- retail: Mega Children's Wear123 m
- retail: Perfect Jewellery125 m
- retail: Payless Photocopy128 m
- retail: Koodo132 m
- retail: O'Toole's Fine Jewellery132 m
- transit stop: Opposite 1700 Wilson Ave (Sheridan Mall)132 m
- retail: Fashions for You133 m
- transit stop: 1700 Wilson Avenue (Sheridan Mall)136 m
- restaurant: Grill Master136 m
- restaurant: Kin Kin137 m
- retail: Gulliver Travels137 m
- restaurant: El Greeko139 m
- restaurant: Koshi Japan140 m
- retail: Ardene142 m
- retail: Royal Traders142 m
- restaurant: Magic Wok143 m
- retail: Labels143 m
- restaurant: Caribbean Cuisine144 m
- restaurant: Pupusa Latina144 m
- restaurant: KFC145 m
- retail: American Fashions145 m
- retail: Zeyuti's Bulk Food147 m
- retail: NY NY Body Piercing148 m
- retail: Compu-Cell149 m
- retail: Family Leather149 m
- cafe: Tim Hortons149 m
- retail: Mayar Lingerie150 m
- retail: Gadget Plus152 m
- retail: S&H Health Foods154 m
- retail: Elegant Shoes155 m
- retail: Golden Gate Jewellers156 m
- retail: Raymond's Smoke & Gift158 m
- retail: Cindy Fashion158 m
- retail: Nancy's Nails158 m
- retail: Kids City Fashions159 m
- parking lot159 m
- retail: Phone Cards Plus160 m
- retail: Jolly Shoes160 m
- retail: Riz Footwear161 m
- retail: New Yorker's Fashions162 m
Park profile
Five-axis radar across the structural dimensions.
Citywide percentile ranks
Across all Toronto parks in the dataset.
- Overall vitality5th
- Edge activation66th
- Connectivity11th
- Amenity diversity79th
- Natural comfort27th
- Enclosure18th
Most similar parks
Closest in metric space across the five structural dimensions.
- Knott ParkNeighbourhood Park29
- Maywood Tot LotParkette30
- Byng ParkOther28
- HORNER AVENUE SENIORS CENTRE - Building GroundsOther32
- Bayhampton ParketteParkette31
Most opposite parks
Furthest in metric space. Useful for recognising what kind of park this isn’t.
- Kew GardensNeighbourhood Park71
- Leslie Grove ParkParkette68
- Market Lane ParkUrban Plaza63
- ALEX WILSON COMMUNITY GARDEN - Open Green SpaceUrban Plaza59
- Sir Winston Churchill ParkRavine / Naturalized Park69
Human activity signals: not available
No activity signals have landed for this park yet. The model has scored its physical form but it can’t yet say how often it’s programmed, photographed, or walked through. See /data-ethics for what we will and will not collect.
Does this score feel accurate?
Your read of Downsview Park And Lawn Bowling Greensmatters. We’re testing whether the model lines up with how people actually use the park. Submissions are stored locally; no account needed.
Tell us how this park feels
We measure structure (canopy, edges, connectivity). You measure feeling. Both matter, and disagreement is itself useful civic data.
What would improve this park?
Generated from the weakest measured dimensions: a starting point, not a prescription.
- Activate the edges: encourage cafés, retail or community uses on the streets that face the park; replace blank or parking-lot edges where possible.
- Add or open more entrances and improve sidewalk continuity around the park. More permeability means more spontaneous use.
- Diversify what people can do in the park (playground, washroom, water, shade, performance, sport, garden): even small additions raise this score.
- Increase canopy and reduce paved area. Shade and water features extend usable hours and seasons.
- Mitigate border vacuums (highways, rail, parking) with active programming on the still-permeable edges and treat the hostile edge as a design challenge.
Data sources
- City of Toronto Open Data: Parks (Green Space)Polygon boundaries, official names, types.
- Parks & Recreation FacilitiesInventory of in-park amenities (washrooms, fields, rinks…).
- Toronto Pedestrian NetworkSidewalk segments around and through parks; estimated park entrances.
- Toronto Centreline V2Street segments + intersection nodes near park edges; trails and walkways.
- Toronto 3D MassingBuilding footprints + heights for edge-building counts, frontage density, and tower-in-the-park risk.
- Toronto Treed AreaTree canopy share inside park polygons via stratified-grid sampling.
- Toronto Waterbodies & RiversWater surface inside parks + nearest-water distance for cooling.
- Ravine & Natural Feature ProtectionRavine overlap as a cooling / natural-comfort signal.
- Toronto Street Tree InventoryTree count + density inside park polygons.
- Neighbourhood Profiles(Pending) Equity context proxy.
- OpenStreetMap (Overpass API)Cafés, restaurants, retail, transit stops, parking, highways, rail.