Symington Avenue Playground
Athletic / Recreation Park, middle of the pack overall (score 35, rank ~56th percentile). Strongest: amenity diversity; weakest: natural comfort.
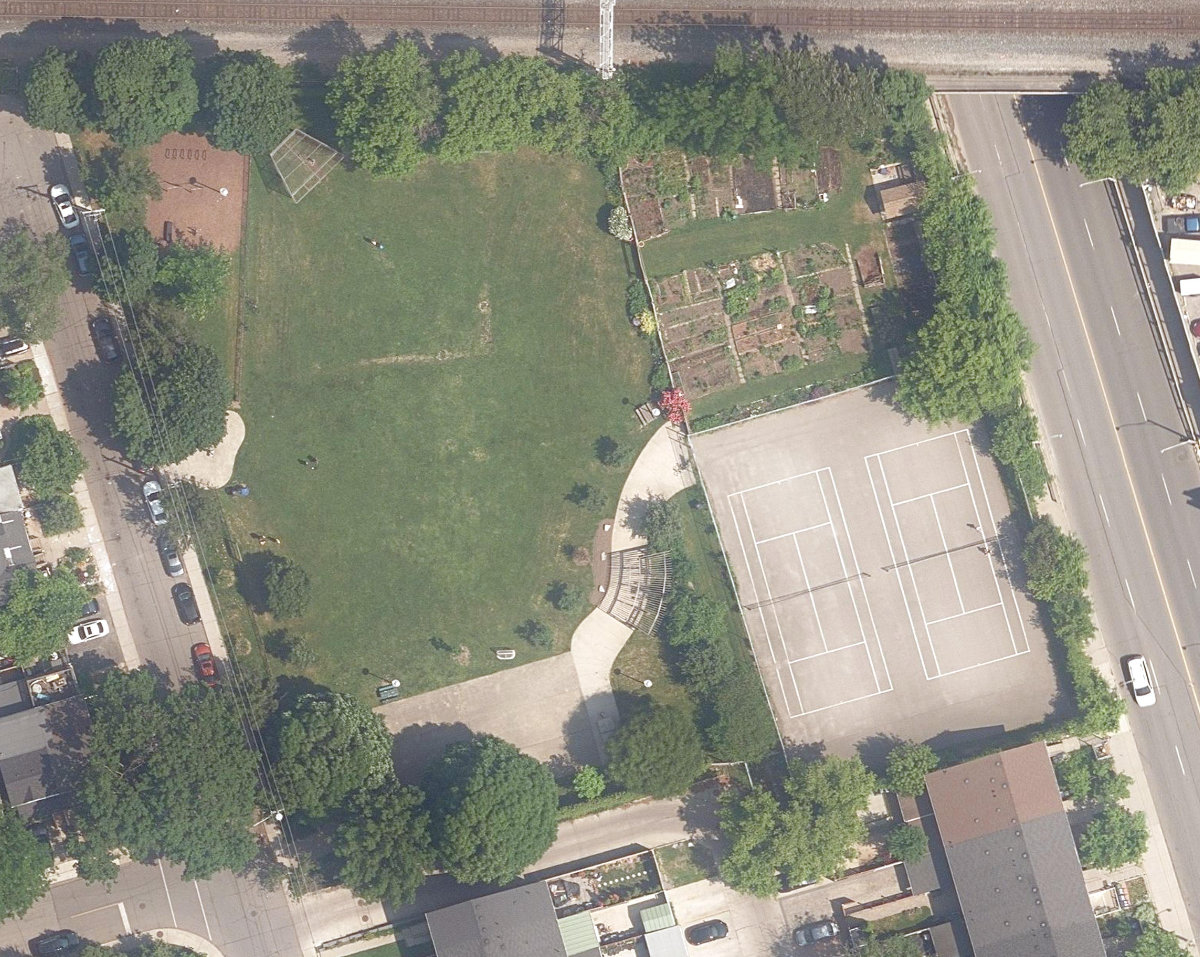
Aerial, City of Toronto orthophoto, ~8 cm/px source · cached 5/9/2026
Symington Avenue Playground scores 35.3 / 100. Strongest dimensions: enclosure / eyes on park and connectivity. Weakest: edge activation (17.1). Border-vacuum risk is elevated (66). This score is a transparent reading of Jane Jacobs-style vitality factors, not a definitive judgment.
Area · 0.61 ha
Weighted across six dimensions · confidence 66%
Scores are not bell-curved. Percentiles and expected scores provide context without changing the underlying model.
Loading map…
The parks map is loading.Explain this score
Where did the 35 come from? Each weighted contribution against a neutral 50 baseline. Green = pushed up; red = pulled down.
Sum of contributions = the headline score. A negative bar means that dimension dragged the park below the city-wide neutral baseline.
Why this park works
Symington Avenue Playground works because its amenity diversity score (27) is in the top tier and its edge activation (17) is also top quartile.
What limits this park
Symington Avenue Playground is held back by natural comfort (36, below-average): only 0% canopy means little summer shade; border-vacuum risk is also elevated (66).
Most distinctive characteristic
Most distinctive feature: exceptionally high amenity diversity (27, top decile).
Jacobs reading
Symington Avenue Playground sits between an urban social park and an ecological retreat: moderately useful for both, exceptionally suited to neither.
Tradeoffs
- The park is enclosed by buildings (67) but the surrounding streets are quiet (edge activation 17): frame without animation.
Performance in context
- Reads as a modest underperformer relative to comparable parks (gap -6; cohort: Athletic / Recreation Park).
- Citywide rank is high (56th) but typology rank is more modest (9th): the strength likely comes from the dataset average pulling lower than this typology’s baseline.
Typology classification
Classified as Athletic / Recreation Park: 67% of amenity types are athletic (sports_field, tennis)
Edge Activation
Within 100 m of the park edge: 8 active uses (retail, transit_stop, restaurant) and 5 dead/hostile uses (rail, parking_lot). Active edges keep "eyes on the park" through the day; parking lots, blank institutional walls, rail and highway frontages drain street life.
Source: OSM POIs (amenity/shop) + Toronto Building Footprints + land use
Connectivity
Connectivity blends paths, intersections, transit, entrances, and edge density. This park has 0 mapped paths/walkways and 6 sidewalk segments within 50 m; 14 street intersections within 100 m; 14 transit stops within a 400 m walk; 0 estimated access points across ~322 m of perimeter. edge density is healthy, no superblock penalty. Source coverage: centreline, pedestrian_network, transit_osm.
Source: Toronto Centreline V2 + Pedestrian Network + OSM transit stops
Amenity Diversity
3 distinct amenity types in the park (fitness, sports_field, tennis). Diversity, not raw count, drives the score so a park with many distinct activity types can outrank a larger park that repeats the same use.
Source: Toronto Parks & Recreation Facilities + OSM amenity tags
Natural Comfort
Natural-comfort components for this park: ~4.2% effective canopy (0.0% from contiguous tree polygons + scattered tree density); 6 city-mapped trees inside the polygon (6.0/ha). Reading: exposed. Source coverage: street_trees. Impervious surface is approximated (Toronto's authoritative layer ships only as a raster GeoTIFF).
Source: Toronto Treed Area + Ravine + Waterbodies + Street Tree Inventory
Enclosure / Eyes on Park
38 buildings within 25 m of the park edge (1 mid-rise, 37 low-rise, 0 tower); avg edge height 6.4 m (~2 floors); 11.8 buildings per 100 m of 322 m perimeter (strong frontage density); edges are low-rise (mostly 2 to 3 floors); no towers immediately adjacent. "Eyes on the park" come strongest from the 1 mid-rise edge buildings.
Source: Toronto 3D Massing (building footprints + heights)
Border Vacuum Risk
Border-vacuum factors within 50 m of the park: North Toronto Subdivision, North Toronto Subdivision, parking_lot, rail. Jacobs warned that highways, rail, parking lots and blank institutional edges act as "vacuums" that suppress foot traffic and isolate the park from its neighbourhood.
Source: Toronto Street Centreline (highways) + rail layer + OSM landuse + building footprints
Equity Context
Equity Context requires inputs not yet loaded for this park (Toronto Neighbourhood Profiles). Score is held at a neutral 50 with low confidence. Read with caution.
Source: Toronto Neighbourhood Profiles
Amenities (3 types · 4 records)
- fitness
- sports field
- tennis
Nearby active-edge features (45)
- rail: North Toronto Subdivision12 m
- rail: North Toronto Subdivision15 m
- rail28 m
- retail: Caldense Bakery33 m
- parking lot48 m
- retail: The Beer Store50 m
- transit stop: Symington Ave at Dupont St72 m
- restaurant: Gus Tacos81 m
- transit stop: Dupont St at Symington Ave84 m
- transit stop: Symington Ave at Adrian Ave92 m
- transit stop: Dupont St at Symington Ave96 m
- retail: 100% SILK Shop + Gallery98 m
- parking lot99 m
- retail102 m
- parking lot104 m
- rail: North Toronto Subdivision105 m
- transit stop: Dupont Street106 m
- transit stop: Dupont St at Perth Ave115 m
- parking lot115 m
- restaurant: Taqueria Vegana121 m
- restaurant: Souvlaki Emporium122 m
- retail: Stay Home Furnishings123 m
- retail: The Boho Lab124 m
- restaurant: Domino's124 m
- restaurant: Thai Lime126 m
- restaurant: Koji Sushi127 m
- restaurant: Columbian Street Food128 m
- retail: Friends Salon Nail & Spa129 m
- restaurant: Gaivota Sports Bar130 m
- retail: Casa Blanca Hairstyling For Men & Women133 m
- parking lot137 m
- retail: HIQ Cannabis138 m
- restaurant: Defina Wood Fired139 m
- restaurant: Enoteca Rossio146 m
- transit stop: Symington Ave at Kingsley St155 m
- retail: Salon Araujo158 m
- parking lot160 m
- restaurant: Dotty's161 m
- community: Junction Triangle164 m
- transit stop: Dupont St at Franklin Ave165 m
- parking lot168 m
- rail170 m
- parking lot171 m
- parking lot178 m
- cafe: Hale Coffee180 m
Park profile
Five-axis radar across the structural dimensions.
Citywide percentile ranks
Across all Toronto parks in the dataset.
- Overall vitality56th
- Edge activation77th
- Connectivity56th
- Amenity diversity92th
- Natural comfort26th
- Enclosure62th
Most similar parks
Closest in metric space across the five structural dimensions.
- Mossgrove ParkCorridor / Linear Park41
- Mary Harker ParkNeighbourhood Park39
- Wellesworth ParkNeighbourhood Park42
- Highland Heights ParkNeighbourhood Park37
- Warden ParkNeighbourhood Park34
Most opposite parks
Furthest in metric space. Useful for recognising what kind of park this isn’t.
- Trca Lands ( 26)Ravine / Naturalized Park27
- Toronto Islands - Muggs Island ParkRavine / Naturalized Park25
- Rouge ParkRavine / Naturalized Park28
- Rouge ParkRavine / Naturalized Park26
- Rouge ParkWaterfront Park25
Human activity signals: not available
No activity signals have landed for this park yet. The model has scored its physical form but it can’t yet say how often it’s programmed, photographed, or walked through. See /data-ethics for what we will and will not collect.
Does this score feel accurate?
Your read of Symington Avenue Playgroundmatters. We’re testing whether the model lines up with how people actually use the park. Submissions are stored locally; no account needed.
Tell us how this park feels
We measure structure (canopy, edges, connectivity). You measure feeling. Both matter, and disagreement is itself useful civic data.
What would improve this park?
Generated from the weakest measured dimensions: a starting point, not a prescription.
- Activate the edges: encourage cafés, retail or community uses on the streets that face the park; replace blank or parking-lot edges where possible.
- Diversify what people can do in the park (playground, washroom, water, shade, performance, sport, garden): even small additions raise this score.
- Increase canopy and reduce paved area. Shade and water features extend usable hours and seasons.
- Mitigate border vacuums (highways, rail, parking) with active programming on the still-permeable edges and treat the hostile edge as a design challenge.
Data sources
- City of Toronto Open Data: Parks (Green Space)Polygon boundaries, official names, types.
- Parks & Recreation FacilitiesInventory of in-park amenities (washrooms, fields, rinks…).
- Toronto Pedestrian NetworkSidewalk segments around and through parks; estimated park entrances.
- Toronto Centreline V2Street segments + intersection nodes near park edges; trails and walkways.
- Toronto 3D MassingBuilding footprints + heights for edge-building counts, frontage density, and tower-in-the-park risk.
- Toronto Treed AreaTree canopy share inside park polygons via stratified-grid sampling.
- Toronto Waterbodies & RiversWater surface inside parks + nearest-water distance for cooling.
- Ravine & Natural Feature ProtectionRavine overlap as a cooling / natural-comfort signal.
- Toronto Street Tree InventoryTree count + density inside park polygons.
- Neighbourhood Profiles(Pending) Equity context proxy.
- OpenStreetMap (Overpass API)Cafés, restaurants, retail, transit stops, parking, highways, rail.