Neil Mclellan Park
Urban Plaza, middle of the pack overall (score 33, rank ~47th percentile). Strongest: connectivity; weakest: natural comfort.
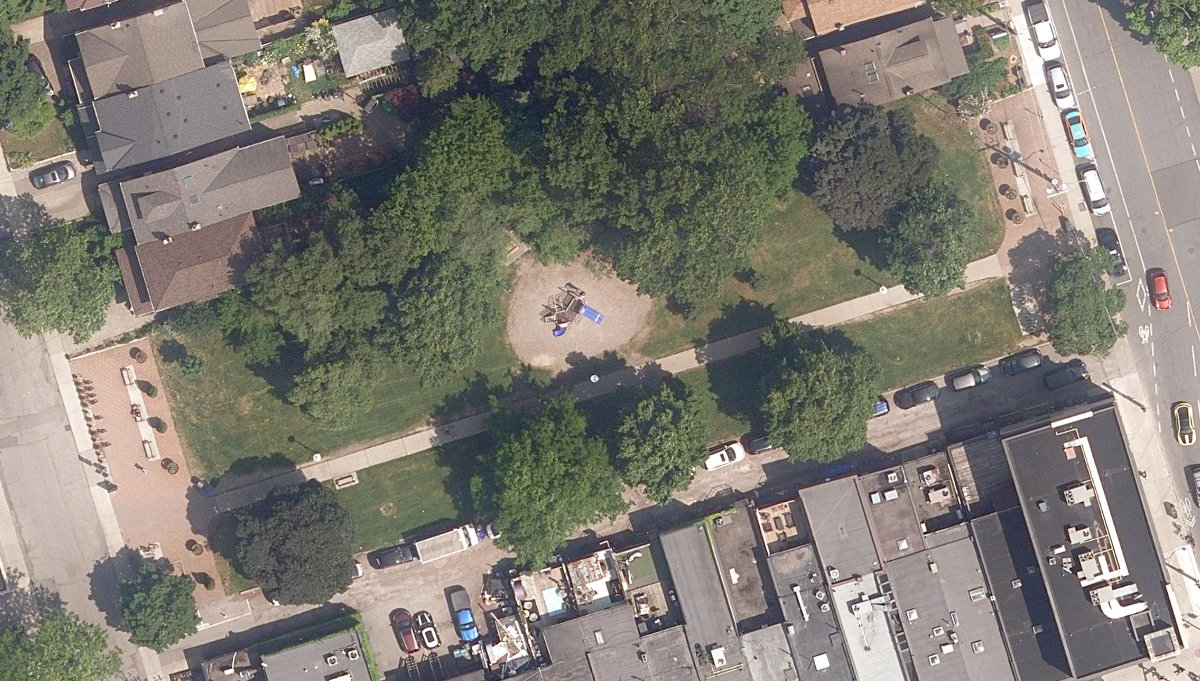
Aerial, City of Toronto orthophoto, ~8 cm/px source · cached 5/9/2026
Neil Mclellan Park scores 33.4 / 100. Strongest dimensions: enclosure / eyes on park and connectivity. Weakest: amenity diversity (11.9). Border-vacuum risk is elevated (100). This score is a transparent reading of Jane Jacobs-style vitality factors, not a definitive judgment.
Area · 0.30 ha
Weighted across six dimensions · confidence 66%
Scores are not bell-curved. Percentiles and expected scores provide context without changing the underlying model.
Loading map…
The parks map is loading.Explain this score
Where did the 33 come from? Each weighted contribution against a neutral 50 baseline. Green = pushed up; red = pulled down.
Sum of contributions = the headline score. A negative bar means that dimension dragged the park below the city-wide neutral baseline.
Why this park works
Neil Mclellan Park works because its connectivity score (67) is in the top tier and its enclosure (82) is also top quartile (18 transit stops sit within a 400 m walk; 9 intersections fall within 100 m of the edge).
What limits this park
Neil Mclellan Park's edges are fronted by border-vacuum land uses (highways, rail, parking, blank institutional), risk score 100.
Most distinctive characteristic
Most distinctive feature: exceptionally high connectivity (67, top quartile).
Jacobs reading
Neil Mclellan Park sits between an urban social park and an ecological retreat: moderately useful for both, exceptionally suited to neither.
Tradeoffs
- The park is enclosed by buildings (82) but the surrounding streets are quiet (edge activation 12): frame without animation.
- High connectivity coexists with high border-vacuum risk (100): much of that connectivity is to highways, rail, or parking lots, not to neighbourhoods.
Performance in context
- Reads as a modest underperformer relative to comparable parks (gap -6; cohort: small Urban Plaza).
Typology classification
Classified as Urban Plaza: 3039 m², paved (0% canopy), 31.4 buildings/100 m
Edge Activation
Within 100 m of the park edge: 70 active uses (restaurant, transit_stop, retail, cafe) and 10 dead/hostile uses (parking_lot, highway, rail). Active edges keep "eyes on the park" through the day; parking lots, blank institutional walls, rail and highway frontages drain street life.
Source: OSM POIs (amenity/shop) + Toronto Building Footprints + land use
Connectivity
Connectivity blends paths, intersections, transit, entrances, and edge density. This park has 5 mapped paths/walkways and 12 sidewalk segments within 50 m; 9 street intersections within 100 m; 18 transit stops within a 400 m walk; 4 estimated access points across ~258 m of perimeter. edge density is healthy, no superblock penalty. Source coverage: centreline, pedestrian_network, transit_osm.
Source: Toronto Centreline V2 + Pedestrian Network + OSM transit stops
Amenity Diversity
1 distinct amenity types in the park (playground). Diversity, not raw count, drives the score so a park with many distinct activity types can outrank a larger park that repeats the same use.
Source: Toronto Parks & Recreation Facilities + OSM amenity tags
Natural Comfort
Natural-comfort components for this park: ~7.7% effective canopy (0.0% from contiguous tree polygons + scattered tree density); nearest waterbody ~569 m; 11 city-mapped trees inside the polygon (11.0/ha). Reading: exposed. Source coverage: waterbodies, street_trees. Impervious surface is approximated (Toronto's authoritative layer ships only as a raster GeoTIFF).
Source: Toronto Treed Area + Ravine + Waterbodies + Street Tree Inventory
Enclosure / Eyes on Park
81 buildings within 25 m of the park edge (9 mid-rise, 72 low-rise, 0 tower); avg edge height 6.9 m (~2 floors); 31.4 buildings per 100 m of 258 m perimeter (strong frontage density); edges are low-rise (mostly 2 to 3 floors); no towers immediately adjacent. "Eyes on the park" come strongest from the 9 mid-rise edge buildings.
Source: Toronto 3D Massing (building footprints + heights)
Border Vacuum Risk
Border-vacuum factors within 50 m of the park: Bloor Street West, Bloor Street West, Bloor Street West, Bloor-Danforth Line, Bloor-Danforth Line, Bloor Street West. Jacobs warned that highways, rail, parking lots and blank institutional edges act as "vacuums" that suppress foot traffic and isolate the park from its neighbourhood.
Source: Toronto Street Centreline (highways) + rail layer + OSM landuse + building footprints
Equity Context
Equity Context requires inputs not yet loaded for this park (Toronto Neighbourhood Profiles). Score is held at a neutral 50 with low confidence. Read with caution.
Source: Toronto Neighbourhood Profiles
Amenities (1 types · 1 records)
- playground
Nearby active-edge features (80)
- rail: Bloor-Danforth Line0 m
- rail: Bloor-Danforth Line0 m
- transit stop18 m
- retail: Gibson's Cleaners20 m
- transit stop: Runnymeade Road21 m
- retail: Capucci Salon27 m
- retail: Rowe Farms27 m
- retail: Bread & Roses28 m
- restaurant: Village Juicery28 m
- retail: Circle K28 m
- retail: Rogers/Fido29 m
- retail: Cora Cuture29 m
- retail: Perfect Nail & Waxing29 m
- retail: Buck's Hard Goods29 m
- retail: Hot Oven Bakery29 m
- restaurant: Ali Baba's30 m
- retail: New Balance30 m
- retail: Her's Fine Lingerie31 m
- transit stop32 m
- retail: Gateway Newstands33 m
- retail: Freedom Mobile34 m
- restaurant: Wingstop36 m
- retail: Telus / Koodo39 m
- restaurant: Kinton Ramen39 m
- highway: Bloor Street West43 m
- highway: Bloor Street West43 m
- retail: Racer Sportif43 m
- highway: Bloor Street West43 m
- transit stop44 m
- retail: Janin's Esthetics45 m
- retail: Dollar+48 m
- retail: Bell48 m
- highway: Bloor Street West50 m
- highway: Bloor Street West52 m
- cafe: Starbucks53 m
- transit stop54 m
- transit stop: Runnymede Station54 m
- retail: Specsavers54 m
- retail: Bloor Village Flowers57 m
- retail: Nexus Printing58 m
- retail: Bloor Optical58 m
- retail: Craig's Cookies58 m
- restaurant: Bukhara Grill58 m
- retail: The Works58 m
- restaurant: Lettuce Love Cafe59 m
- retail: Peachtree Health Foods59 m
- retail: Hakim Optical59 m
- retail: Green Thumb Fruit Market59 m
- restaurant: Simply Thai Cuisine60 m
- retail: D2E Hair Boutique60 m
- restaurant: Popeyes60 m
- restaurant: Shakey's60 m
- retail: Red Label62 m
- retail: WaxOn63 m
- retail: The Ten Spot65 m
- transit stop: Runnymede Rd at Bloor St W66 m
- retail: COBS Bread67 m
- parking lot68 m
- restaurant: Queen's Pasta Café69 m
- cafe: Lermer70 m
- retail: Runnymede Barber Shop71 m
- restaurant: Shelby’s Legendary Shawarma72 m
- restaurant: Shadi Shawarma72 m
- restaurant: Sunshine Village Grill77 m
- restaurant: The Swan80 m
- retail: California Sun Spa82 m
- retail: Northern Reflections83 m
- highway: Bloor Street West84 m
- restaurant: Yogurty's85 m
- transit stop: Runnymede Station85 m
- cafe: Lyla's House87 m
- transit stop: Kennedy Avenue89 m
- retail: New Star Cleaners90 m
- retail: Fig Tree91 m
- retail: Bloor & Kennedy Flowers91 m
- retail: Karpaty Travel92 m
- transit stop: Runnymede92 m
- transit stop: Runnymede92 m
- highway: Bloor Street West99 m
- retail: Meaty Eats100 m
Park profile
Five-axis radar across the structural dimensions.
Citywide percentile ranks
Across all Toronto parks in the dataset.
- Overall vitality47th
- Edge activation71th
- Connectivity87th
- Amenity diversity80th
- Natural comfort43th
- Enclosure86th
Most similar parks
Closest in metric space across the five structural dimensions.
- Dufferin - King ParkUrban Plaza37
- West Birkdale ParkUrban Plaza43
- Skeens Lane ParketteUrban Plaza42
- Eighth Street ParkUrban Plaza42
- Cy Townsend ParkUrban Plaza42
Most opposite parks
Furthest in metric space. Useful for recognising what kind of park this isn’t.
- Trca Lands ( 26)Ravine / Naturalized Park27
- Toronto Islands - Muggs Island ParkRavine / Naturalized Park25
- Rouge ParkRavine / Naturalized Park28
- Rouge ParkWaterfront Park25
- Rouge ParkRavine / Naturalized Park26
Human activity signals: not available
No activity signals have landed for this park yet. The model has scored its physical form but it can’t yet say how often it’s programmed, photographed, or walked through. See /data-ethics for what we will and will not collect.
Does this score feel accurate?
Your read of Neil Mclellan Parkmatters. We’re testing whether the model lines up with how people actually use the park. Submissions are stored locally; no account needed.
Tell us how this park feels
We measure structure (canopy, edges, connectivity). You measure feeling. Both matter, and disagreement is itself useful civic data.
What would improve this park?
Generated from the weakest measured dimensions: a starting point, not a prescription.
- Activate the edges: encourage cafés, retail or community uses on the streets that face the park; replace blank or parking-lot edges where possible.
- Diversify what people can do in the park (playground, washroom, water, shade, performance, sport, garden): even small additions raise this score.
- Increase canopy and reduce paved area. Shade and water features extend usable hours and seasons.
- Mitigate border vacuums (highways, rail, parking) with active programming on the still-permeable edges and treat the hostile edge as a design challenge.
Data sources
- City of Toronto Open Data: Parks (Green Space)Polygon boundaries, official names, types.
- Parks & Recreation FacilitiesInventory of in-park amenities (washrooms, fields, rinks…).
- Toronto Pedestrian NetworkSidewalk segments around and through parks; estimated park entrances.
- Toronto Centreline V2Street segments + intersection nodes near park edges; trails and walkways.
- Toronto 3D MassingBuilding footprints + heights for edge-building counts, frontage density, and tower-in-the-park risk.
- Toronto Treed AreaTree canopy share inside park polygons via stratified-grid sampling.
- Toronto Waterbodies & RiversWater surface inside parks + nearest-water distance for cooling.
- Ravine & Natural Feature ProtectionRavine overlap as a cooling / natural-comfort signal.
- Toronto Street Tree InventoryTree count + density inside park polygons.
- Neighbourhood Profiles(Pending) Equity context proxy.
- OpenStreetMap (Overpass API)Cafés, restaurants, retail, transit stops, parking, highways, rail.