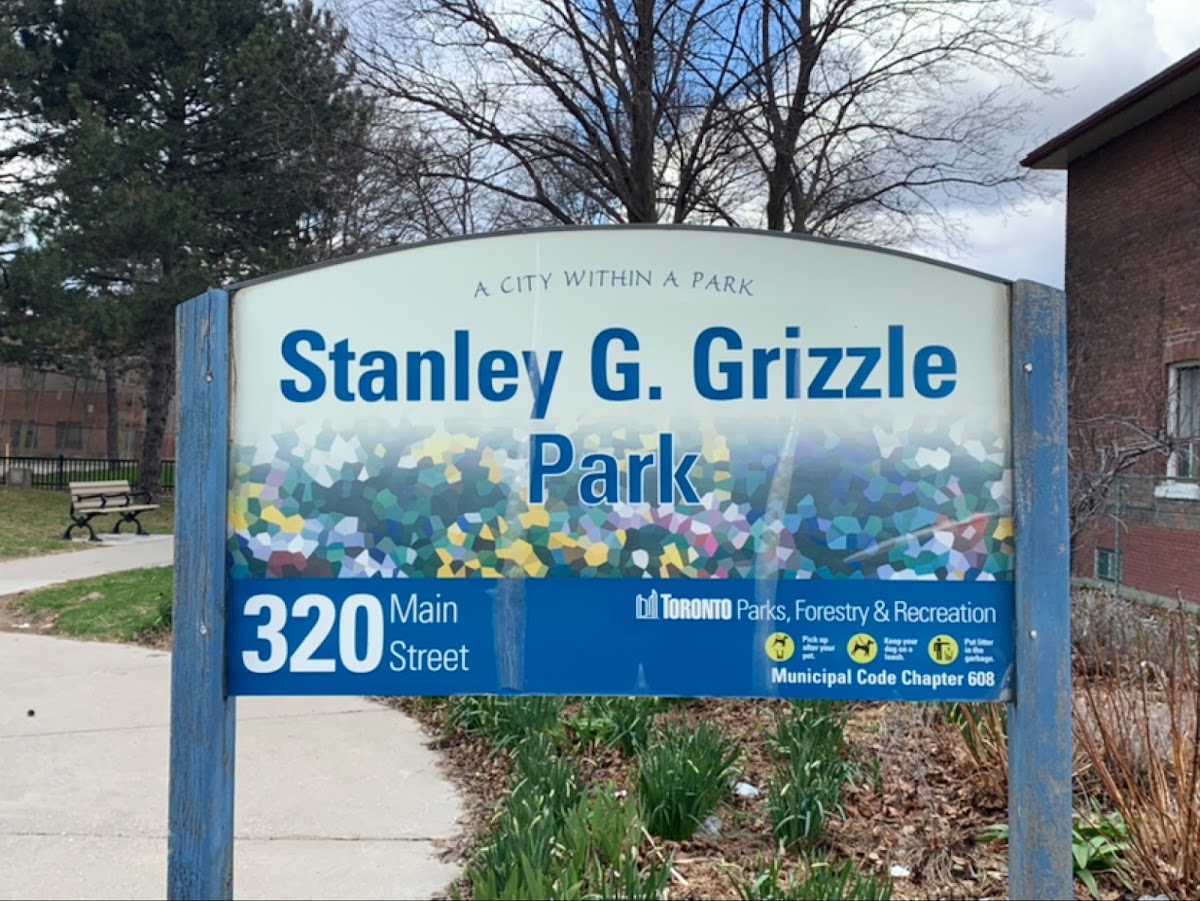
Stanley G. Grizzle Park
Urban Plaza, in the top tier overall (score 46, rank ~90th percentile). Strongest: connectivity; weakest: natural comfort.
Photo by Michael M via Google Places · cached 5/9/2026
Stanley G. Grizzle Park scores 45.8 / 100. Strongest dimensions: enclosure / eyes on park and connectivity. Weakest: amenity diversity (11.9). Border-vacuum risk is low. This score is a transparent reading of Jane Jacobs-style vitality factors, not a definitive judgment.
Area · 0.19 ha
Weighted across six dimensions · confidence 70%
Scores are not bell-curved. Percentiles and expected scores provide context without changing the underlying model.
Loading map…
The parks map is loading.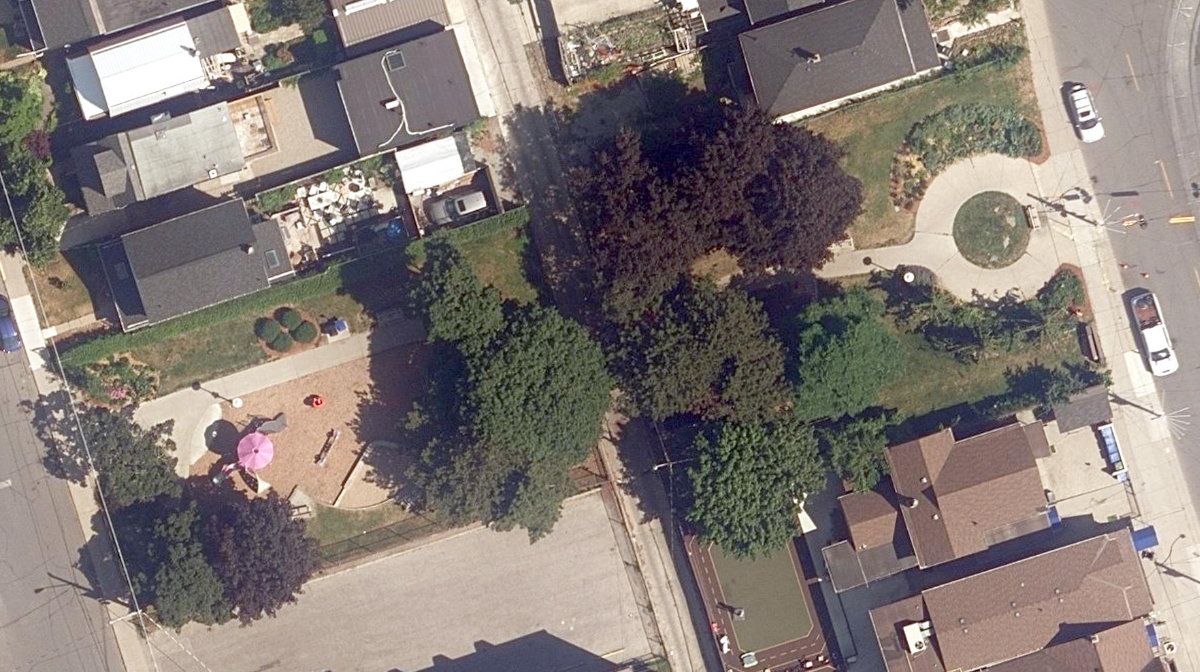
Explain this score
Where did the 46 come from? Each weighted contribution against a neutral 50 baseline. Green = pushed up; red = pulled down.
Sum of contributions = the headline score. A negative bar means that dimension dragged the park below the city-wide neutral baseline.
Why this park works
Stanley G. Grizzle Park works because its connectivity score (71) is in the top tier and its enclosure (84) is also top decile (23 transit stops sit within a 400 m walk; 12 intersections fall within 100 m of the edge).
What limits this park
Stanley G. Grizzle Park doesn't have a clear weakness. Every measured dimension is at or above the middle of the pack.
Most distinctive characteristic
Most distinctive feature: exceptionally high connectivity (71, top decile).
Jacobs reading
Stanley G. Grizzle Park sits between an urban social park and an ecological retreat: moderately useful for both, exceptionally suited to neither.
Tradeoffs
- Connectivity (71) significantly outpaces natural comfort (44): well placed in the city but offers little shade or ecological respite.
- The park is enclosed by buildings (84) but the surrounding streets are quiet (edge activation 22): frame without animation.
Performance in context
- A modest overperformer for its urban plaza typology (+9 vs the median in pocket Urban Plaza).
Typology classification
Classified as Urban Plaza: 1869 m², paved (7% canopy), 41.7 buildings/100 m
Edge Activation
Within 100 m of the park edge: 21 active uses (transit_stop, retail, restaurant) and 7 dead/hostile uses (parking_lot, highway). Active edges keep "eyes on the park" through the day; parking lots, blank institutional walls, rail and highway frontages drain street life.
Source: OSM POIs (amenity/shop) + Toronto Building Footprints + land use
Connectivity
Connectivity blends paths, intersections, transit, entrances, and edge density. This park has 5 mapped paths/walkways and 15 sidewalk segments within 50 m; 12 street intersections within 100 m; 23 transit stops within a 400 m walk; 3 estimated access points across ~204 m of perimeter. edge density is healthy, no superblock penalty. Source coverage: centreline, pedestrian_network, transit_osm.
Source: Toronto Centreline V2 + Pedestrian Network + OSM transit stops
Amenity Diversity
1 distinct amenity types in the park (playground). Diversity, not raw count, drives the score so a park with many distinct activity types can outrank a larger park that repeats the same use.
Source: Toronto Parks & Recreation Facilities + OSM amenity tags
Natural Comfort
Natural-comfort components for this park: 7.1% estimated tree canopy; nearest waterbody ~984 m; 4 city-mapped trees inside the polygon (4.0/ha). Reading: exposed. Source coverage: treed_area, waterbodies, street_trees. Impervious surface is approximated (Toronto's authoritative layer ships only as a raster GeoTIFF).
Source: Toronto Treed Area + Ravine + Waterbodies + Street Tree Inventory
Enclosure / Eyes on Park
85 buildings within 25 m of the park edge (10 mid-rise, 75 low-rise, 0 tower); avg edge height 7.3 m (~2 floors); 41.7 buildings per 100 m of 204 m perimeter (strong frontage density); edges are low-rise (mostly 2 to 3 floors); no towers immediately adjacent. "Eyes on the park" come strongest from the 10 mid-rise edge buildings.
Source: Toronto 3D Massing (building footprints + heights)
Border Vacuum Risk
Border-vacuum factors within 50 m of the park: parking_lot. Jacobs warned that highways, rail, parking lots and blank institutional edges act as "vacuums" that suppress foot traffic and isolate the park from its neighbourhood.
Source: Toronto Street Centreline (highways) + rail layer + OSM landuse + building footprints
Equity Context
Equity Context requires inputs not yet loaded for this park (Toronto Neighbourhood Profiles). Score is held at a neutral 50 with low confidence. Read with caution.
Source: Toronto Neighbourhood Profiles
Amenities (1 types · 1 records)
- playground
Nearby active-edge features (71)
- parking lot6 m
- transit stop: Main Street26 m
- transit stop: Main Street Station34 m
- transit stop: Main Street Station36 m
- retail: Pavillion Pastries Cafe48 m
- parking lot54 m
- transit stop: Main Street Station56 m
- transit stop: Main Street60 m
- transit stop: Main Street60 m
- parking lot60 m
- transit stop: Danforth Avenue62 m
- transit stop: Danforth Avenue64 m
- transit stop: Main Street Station64 m
- restaurant: Sultan Shawarma & Falafel67 m
- transit stop: Main Street Station76 m
- retail: Wellwise77 m
- highway: Danforth Avenue79 m
- highway: Danforth Avenue80 m
- highway: Danforth Avenue82 m
- retail: Dignity Memorial Giffen-Mack Funeral Home86 m
- highway: Danforth Avenue89 m
- transit stop: Main Street Station91 m
- transit stop: Main Street Station93 m
- retail: A to Z Discount97 m
- retail: Perfume Depot & Cosmetics97 m
- retail: ASM Wireless97 m
- retail: Hakim Optical99 m
- transit stop: Danforth Avenue99 m
- retail: Danforth Village100 m
- retail: Real Bargain101 m
- retail: Danforth Picture Frames101 m
- restaurant: Baital Muqadas Halal Pizza & Wings104 m
- retail: Beauty One104 m
- transit stop: Danforth Avenue107 m
- highway: Danforth Avenue107 m
- retail109 m
- highway: Danforth Avenue109 m
- retail: Shewa Grocery & Variety113 m
- retail: A+ Cut115 m
- retail117 m
- cafe: Great Fruit Bubble Tea120 m
- transit stop: Danforth Avenue121 m
- parking lot125 m
- rail: Bloor-Danforth Line126 m
- retail: Selam Furniture & Mattress138 m
- retail: Value Buds143 m
- retail: Growers Retail147 m
- cafe: Press Books Coffee Vinyl147 m
- retail: Main Square Smoke & Gift149 m
- highway: Danforth Avenue150 m
- retail: Arya Bakery153 m
- retail156 m
- cafe: Tim Hortons156 m
- highway: Danforth Avenue161 m
- retail: Budside Cannabis Store162 m
- retail: Wine Rack162 m
- restaurant: Su-Good Chinese Restaurant162 m
- retail: Many Chances Health Spa167 m
- restaurant: Subway167 m
- restaurant: Eva's Bar & Restaurant167 m
- retail: NaNa Florist171 m
- restaurant: Grillies174 m
- retail177 m
- retail: Shega Salon & Aesthetics180 m
- retail: Shoe Avenue184 m
- parking lot185 m
- highway: Danforth Avenue187 m
- retail: Yonges E-Bikes188 m
- restaurant: Len Duckworth Fish&Chips188 m
- retail: Saffron Halal Meat194 m
- retail199 m
Park profile
Five-axis radar across the structural dimensions.
Citywide percentile ranks
Across all Toronto parks in the dataset.
- Overall vitality90th
- Edge activation79th
- Connectivity91th
- Amenity diversity84th
- Natural comfort47th
- Enclosure90th
Most similar parks
Closest in metric space across the five structural dimensions.
- Westmoreland Avenue ParketteUrban Plaza40
- West Birkdale ParkUrban Plaza43
- Nightstar ParkUrban Plaza46
- Columbus ParketteUrban Plaza49
- Avondale ParkParkette50
Most opposite parks
Furthest in metric space. Useful for recognising what kind of park this isn’t.
- Toronto Islands - Muggs Island ParkRavine / Naturalized Park25
- Trca Lands ( 26)Ravine / Naturalized Park27
- Rouge ParkWaterfront Park25
- Rouge ParkRavine / Naturalized Park28
- Rouge ParkRavine / Naturalized Park26
Visitor signals
Public attention measured by Google Places aggregates. This proxies attention, not occupancy. Aggregate-only: no usernames, no review text, no extra photos beyond the cached hero.
p35 citywide · p23 within Urban Plaza
Source: Google Places API · match high (0.97 composite confidence) · last refreshed 5/9/2026. Privacy contract. Measures public attention, not occupancy.
Human activity signals: not available
No activity signals have landed for this park yet. The model has scored its physical form but it can’t yet say how often it’s programmed, photographed, or walked through. See /data-ethics for what we will and will not collect.
Does this score feel accurate?
Your read of Stanley G. Grizzle Parkmatters. We’re testing whether the model lines up with how people actually use the park. Submissions are stored locally; no account needed.
Tell us how this park feels
We measure structure (canopy, edges, connectivity). You measure feeling. Both matter, and disagreement is itself useful civic data.
What would improve this park?
Generated from the weakest measured dimensions: a starting point, not a prescription.
- Activate the edges: encourage cafés, retail or community uses on the streets that face the park; replace blank or parking-lot edges where possible.
- Diversify what people can do in the park (playground, washroom, water, shade, performance, sport, garden): even small additions raise this score.
- Increase canopy and reduce paved area. Shade and water features extend usable hours and seasons.
Data sources
- City of Toronto Open Data: Parks (Green Space)Polygon boundaries, official names, types.
- Parks & Recreation FacilitiesInventory of in-park amenities (washrooms, fields, rinks…).
- Toronto Pedestrian NetworkSidewalk segments around and through parks; estimated park entrances.
- Toronto Centreline V2Street segments + intersection nodes near park edges; trails and walkways.
- Toronto 3D MassingBuilding footprints + heights for edge-building counts, frontage density, and tower-in-the-park risk.
- Toronto Treed AreaTree canopy share inside park polygons via stratified-grid sampling.
- Toronto Waterbodies & RiversWater surface inside parks + nearest-water distance for cooling.
- Ravine & Natural Feature ProtectionRavine overlap as a cooling / natural-comfort signal.
- Toronto Street Tree InventoryTree count + density inside park polygons.
- Neighbourhood Profiles(Pending) Equity context proxy.
- OpenStreetMap (Overpass API)Cafés, restaurants, retail, transit stops, parking, highways, rail.