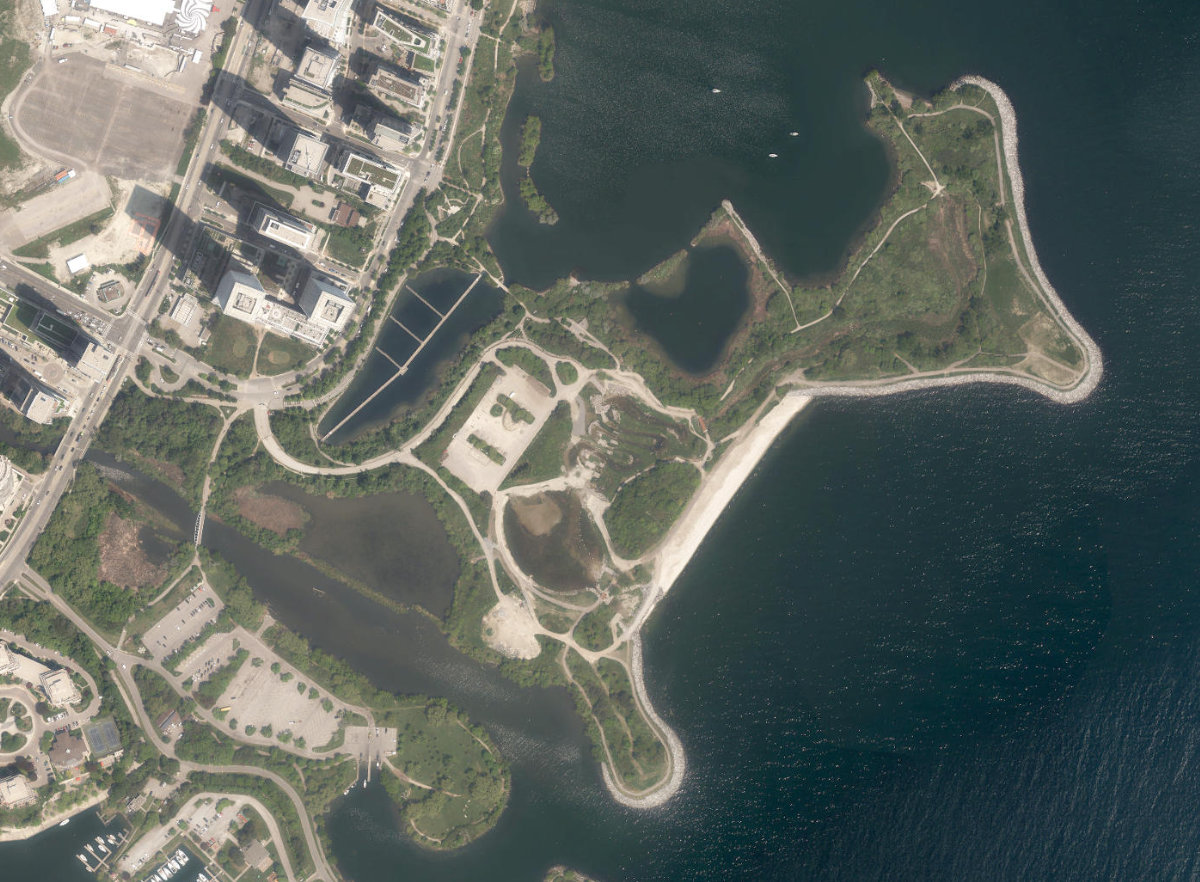
Humber Bay Park East
Waterfront Park, middle of the pack overall (score 31, rank ~34th percentile). Strongest: connectivity; weakest: enclosure.
Aerial, City of Toronto orthophoto, ~8 cm/px source · cached 5/9/2026
Humber Bay Park East scores 30.7 / 100. Strongest dimensions: connectivity and natural comfort. Weakest: amenity diversity (0). Border-vacuum risk is elevated (90). This score is a transparent reading of Jane Jacobs-style vitality factors, not a definitive judgment.
Area · 20.70 ha
Weighted across six dimensions · confidence 63%
Scores are not bell-curved. Percentiles and expected scores provide context without changing the underlying model.
Loading map…
The parks map is loading.Explain this score
Where did the 31 come from? Each weighted contribution against a neutral 50 baseline. Green = pushed up; red = pulled down.
Sum of contributions = the headline score. A negative bar means that dimension dragged the park below the city-wide neutral baseline.
Why this park works
Humber Bay Park East works because its connectivity score (67) is in the top tier and its edge activation (27) is also top quartile (16 transit stops sit within a 400 m walk; 10 intersections fall within 100 m of the edge).
What limits this park
Humber Bay Park East is held back by enclosure (31, bottom quartile); border-vacuum risk is also elevated (90).
Most distinctive characteristic
Most distinctive feature: exceptionally low enclosure (31, bottom quartile).
Jacobs reading
Humber Bay Park East sits between an urban social park and an ecological retreat: moderately useful for both, exceptionally suited to neither.
Tradeoffs
- 12 nearby towers cast wind and shadow without contributing canopy: passive surveillance is plentiful but human-scale comfort is not.
- High connectivity coexists with high border-vacuum risk (90): much of that connectivity is to highways, rail, or parking lots, not to neighbourhoods.
Performance in context
- Reads as a modest underperformer relative to comparable parks (gap -7; cohort: large Waterfront Park waterfront).
Typology classification
Classified as Waterfront Park: 14% water surface inside park
Edge Activation
Within 100 m of the park edge: 12 active uses (transit_stop, restaurant, cafe, school) and 5 dead/hostile uses (highway, parking_lot). Active edges keep "eyes on the park" through the day; parking lots, blank institutional walls, rail and highway frontages drain street life.
Source: OSM POIs (amenity/shop) + Toronto Building Footprints + land use
Connectivity
Connectivity blends paths, intersections, transit, entrances, and edge density. This park has 59 mapped paths/walkways and 110 sidewalk segments within 50 m; 10 street intersections within 100 m; 16 transit stops within a 400 m walk; 17 estimated access points across ~4,123 m of perimeter. low edge density, significant superblock penalty applied. Source coverage: centreline, pedestrian_network, transit_osm.
Source: Toronto Centreline V2 + Pedestrian Network + OSM transit stops
Amenity Diversity
No amenities recorded. Score is 0 until inventory is loaded.
Source: Toronto Parks & Recreation Facilities + OSM amenity tags
Natural Comfort
Natural-comfort components for this park: ~3.2% effective canopy (2.2% from contiguous tree polygons + scattered tree density); 3.5% inside the ravine system; 14.3% water surface; 96 city-mapped trees inside the polygon (4.6/ha). Reading: water-cooled. Source coverage: treed_area, ravine, waterbodies, street_trees. Impervious surface is approximated (Toronto's authoritative layer ships only as a raster GeoTIFF).
Source: Toronto Treed Area + Ravine + Waterbodies + Street Tree Inventory
Enclosure / Eyes on Park
41 buildings within 25 m of the park edge (24 mid-rise, 5 low-rise, 12 tower); avg edge height 41.4 m (~14 floors); 1.0 buildings per 100 m of 4,123 m perimeter (thin frontage with significant blank-edge share); edges dominated by towers; 12 towers ≥ 40 m within 25 m of the edge. "Eyes on the park" come strongest from the 24 mid-rise edge buildings.
Source: Toronto 3D Massing (building footprints + heights)
Border Vacuum Risk
Border-vacuum factors within 50 m of the park: Lake Shore Boulevard West, Lake Shore Boulevard West, Lake Shore Boulevard West. Jacobs warned that highways, rail, parking lots and blank institutional edges act as "vacuums" that suppress foot traffic and isolate the park from its neighbourhood.
Source: Toronto Street Centreline (highways) + rail layer + OSM landuse + building footprints
Equity Context
Equity Context requires inputs not yet loaded for this park (Toronto Neighbourhood Profiles). Score is held at a neutral 50 with low confidence. Read with caution.
Source: Toronto Neighbourhood Profiles
Amenities (0)
No amenities recorded for this park.
Nearby active-edge features (39)
- transit stop: Marine Parade Dr Loop at Lake Shore Blvd W0 m
- restaurant: Huevos Gourmet12 m
- highway: Lake Shore Boulevard West18 m
- highway: Lake Shore Boulevard West23 m
- transit stop: Park Lawn Road24 m
- transit stop: Park Lawn Road24 m
- highway: Lake Shore Boulevard West31 m
- cafe: Zen Cafe+48 m
- cafe: Holo Tea & Cafe54 m
- restaurant: Oakberry Açai55 m
- transit stop: Park Lawn Rd at Lake Shore Blvd W60 m
- transit stop61 m
- school: Kingsway College School64 m
- highway: Lake Shore Boulevard West77 m
- transit stop: Park Lawn Rd at Lake Shore Blvd W88 m
- restaurant: Sunset Grill89 m
- parking lot91 m
- highway: Lake Shore Boulevard West107 m
- parking lot125 m
- parking lot129 m
- retail: LCBO132 m
- retail: Metro133 m
- retail: Top Modern Nail Spa135 m
- highway: Lake Shore Boulevard West140 m
- cafe: Starbucks142 m
- parking lot149 m
- retail: Platis Cleaners150 m
- cafe: Kung Fu Tea156 m
- retail: Lakeview Vision157 m
- restaurant: Panago158 m
- retail: Hasty Market160 m
- restaurant: Fresh Pizza Plus170 m
- retail: Park Lawn Cleaners174 m
- retail: En Vogue Hair Salon & Spa180 m
- parking lot180 m
- parking lot182 m
- retail188 m
- transit stop: Legion Road190 m
- parking lot196 m
Park profile
Five-axis radar across the structural dimensions.
Citywide percentile ranks
Across all Toronto parks in the dataset.
- Overall vitality34th
- Edge activation86th
- Connectivity87th
- Amenity diversity65th
- Natural comfort44th
- Enclosure4th
Most similar parks
Closest in metric space across the five structural dimensions.
- Toronto ZooRavine / Naturalized Park36
- Downsview ParkOther37
- Toronto ZooRavine / Naturalized Park35
- North York Hydro Green SpaceOther36
- Scarborough Hydro Green SpaceNeighbourhood Park42
Most opposite parks
Furthest in metric space. Useful for recognising what kind of park this isn’t.
- Joseph Burr Tyrrell ParkUrban Plaza50
- City Wide Open SpaceRavine / Naturalized Park39
- Lower Don ParklandsRavine / Naturalized Park33
- Trca Lands ( 50)Ravine / Naturalized Park33
- The Mission Ground ParketteParkette33
Human activity signals: not available
No activity signals have landed for this park yet. The model has scored its physical form but it can’t yet say how often it’s programmed, photographed, or walked through. See /data-ethics for what we will and will not collect.
Does this score feel accurate?
Your read of Humber Bay Park Eastmatters. We’re testing whether the model lines up with how people actually use the park. Submissions are stored locally; no account needed.
Tell us how this park feels
We measure structure (canopy, edges, connectivity). You measure feeling. Both matter, and disagreement is itself useful civic data.
What would improve this park?
Generated from the weakest measured dimensions: a starting point, not a prescription.
- Activate the edges: encourage cafés, retail or community uses on the streets that face the park; replace blank or parking-lot edges where possible.
- Diversify what people can do in the park (playground, washroom, water, shade, performance, sport, garden): even small additions raise this score.
- Increase canopy and reduce paved area. Shade and water features extend usable hours and seasons.
- Encourage mid-rise, windowed frontages around the park so residents have direct sightlines onto it.
- Mitigate border vacuums (highways, rail, parking) with active programming on the still-permeable edges and treat the hostile edge as a design challenge.
Data sources
- City of Toronto Open Data: Parks (Green Space)Polygon boundaries, official names, types.
- Parks & Recreation FacilitiesInventory of in-park amenities (washrooms, fields, rinks…).
- Toronto Pedestrian NetworkSidewalk segments around and through parks; estimated park entrances.
- Toronto Centreline V2Street segments + intersection nodes near park edges; trails and walkways.
- Toronto 3D MassingBuilding footprints + heights for edge-building counts, frontage density, and tower-in-the-park risk.
- Toronto Treed AreaTree canopy share inside park polygons via stratified-grid sampling.
- Toronto Waterbodies & RiversWater surface inside parks + nearest-water distance for cooling.
- Ravine & Natural Feature ProtectionRavine overlap as a cooling / natural-comfort signal.
- Toronto Street Tree InventoryTree count + density inside park polygons.
- Neighbourhood Profiles(Pending) Equity context proxy.
- OpenStreetMap (Overpass API)Cafés, restaurants, retail, transit stops, parking, highways, rail.